ClimateChange Assessment Guide.pdf - University of Waterloo
ClimateChange Assessment Guide.pdf - University of Waterloo
ClimateChange Assessment Guide.pdf - University of Waterloo
Create successful ePaper yourself
Turn your PDF publications into a flip-book with our unique Google optimized e-Paper software.
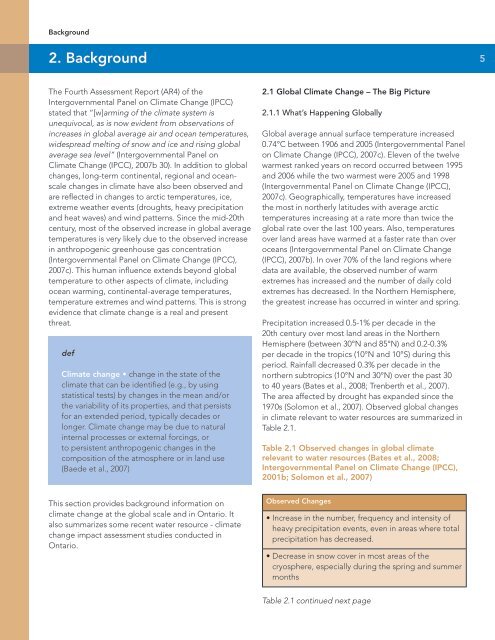
Background2. Background5The Fourth <strong>Assessment</strong> Report (AR4) <strong>of</strong> theIntergovernmental Panel on Climate Change (IPCC)stated that “[w]arming <strong>of</strong> the climate system isunequivocal, as is now evident from observations <strong>of</strong>increases in global average air and ocean temperatures,widespread melting <strong>of</strong> snow and ice and rising globalaverage sea level” (Intergovernmental Panel onClimate Change (IPCC), 2007b 30). In addition to globalchanges, long-term continental, regional and oceanscalechanges in climate have also been observed andare reflected in changes to arctic temperatures, ice,extreme weather events (droughts, heavy precipitationand heat waves) and wind patterns. Since the mid-20thcentury, most <strong>of</strong> the observed increase in global averagetemperatures is very likely due to the observed increasein anthropogenic greenhouse gas concentration(Intergovernmental Panel on Climate Change (IPCC),2007c). This human influence extends beyond globaltemperature to other aspects <strong>of</strong> climate, includingocean warming, continental-average temperatures,temperature extremes and wind patterns. This is strongevidence that climate change is a real and presentthreat.defClimate change • change in the state <strong>of</strong> theclimate that can be identified (e.g., by usingstatistical tests) by changes in the mean and/orthe variability <strong>of</strong> its properties, and that persistsfor an extended period, typically decades orlonger. Climate change may be due to naturalinternal processes or external forcings, orto persistent anthropogenic changes in thecomposition <strong>of</strong> the atmosphere or in land use(Baede et al., 2007)2.1 Global Climate Change – The Big Picture2.1.1 What’s Happening GloballyGlobal average annual surface temperature increased0.74°C between 1906 and 2005 (Intergovernmental Panelon Climate Change (IPCC), 2007c). Eleven <strong>of</strong> the twelvewarmest ranked years on record occurred between 1995and 2006 while the two warmest were 2005 and 1998(Intergovernmental Panel on Climate Change (IPCC),2007c). Geographically, temperatures have increasedthe most in northerly latitudes with average arctictemperatures increasing at a rate more than twice theglobal rate over the last 100 years. Also, temperaturesover land areas have warmed at a faster rate than overoceans (Intergovernmental Panel on Climate Change(IPCC), 2007b). In over 70% <strong>of</strong> the land regions wheredata are available, the observed number <strong>of</strong> warmextremes has increased and the number <strong>of</strong> daily coldextremes has decreased. In the Northern Hemisphere,the greatest increase has occurred in winter and spring.Precipitation increased 0.5-1% per decade in the20th century over most land areas in the NorthernHemisphere (between 30°N and 85°N) and 0.2-0.3%per decade in the tropics (10°N and 10°S) during thisperiod. Rainfall decreased 0.3% per decade in thenorthern subtropics (10°N and 30°N) over the past 30to 40 years (Bates et al., 2008; Trenberth et al., 2007).The area affected by drought has expanded since the1970s (Solomon et al., 2007). Observed global changesin climate relevant to water resources are summarized inTable 2.1.Table 2.1 Observed changes in global climaterelevant to water resources (Bates et al., 2008;Intergovernmental Panel on Climate Change (IPCC),2001b; Solomon et al., 2007)This section provides background information onclimate change at the global scale and in Ontario. Italso summarizes some recent water resource - climatechange impact assessment studies conducted inOntario.Observed Changes• Increase in the number, frequency and intensity <strong>of</strong>heavy precipitation events, even in areas where totalprecipitation has decreased.• Decrease in snow cover in most areas <strong>of</strong> thecryosphere, especially during the spring and summermonthsTable 2.1 continued next page


