

ClimateChange Assessment Guide.pdf - University of Waterloo
ClimateChange Assessment Guide.pdf - University of Waterloo
ClimateChange Assessment Guide.pdf - University of Waterloo

Create successful ePaper yourself
Turn your PDF publications into a flip-book with our unique Google optimized e-Paper software.
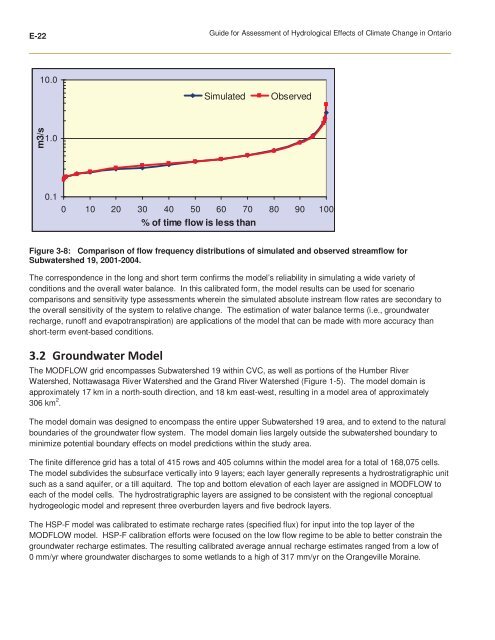
E-22<strong>Guide</strong> for <strong>Assessment</strong> <strong>of</strong> Hydrological Effects <strong>of</strong> Climate Change in Ontario10.0SimulatedObservedm3/s1.00.10 10 20 30 40 50 60 70 80 90 100% <strong>of</strong> time flow is less thanFigure 3-8: Comparison <strong>of</strong> flow frequency distributions <strong>of</strong> simulated and observed streamflow forSubwatershed 19, 2001-2004.The correspondence in the long and short term confirms the model’s reliability in simulating a wide variety <strong>of</strong>conditions and the overall water balance. In this calibrated form, the model results can be used for scenariocomparisons and sensitivity type assessments wherein the simulated absolute instream flow rates are secondary tothe overall sensitivity <strong>of</strong> the system to relative change. The estimation <strong>of</strong> water balance terms (i.e., groundwaterrecharge, run<strong>of</strong>f and evapotranspiration) are applications <strong>of</strong> the model that can be made with more accuracy thanshort-term event-based conditions. The MODFLOW grid encompasses Subwatershed 19 within CVC, as well as portions <strong>of</strong> the Humber RiverWatershed, Nottawasaga River Watershed and the Grand River Watershed (Figure 1-5). The model domain isapproximately 17 km in a north-south direction, and 18 km east-west, resulting in a model area <strong>of</strong> approximately306 km 2 .The model domain was designed to encompass the entire upper Subwatershed 19 area, and to extend to the naturalboundaries <strong>of</strong> the groundwater flow system. The model domain lies largely outside the subwatershed boundary tominimize potential boundary effects on model predictions within the study area.The finite difference grid has a total <strong>of</strong> 415 rows and 405 columns within the model area for a total <strong>of</strong> 168,075 cells.The model subdivides the subsurface vertically into 9 layers; each layer generally represents a hydrostratigraphic unitsuch as a sand aquifer, or a till aquitard. The top and bottom elevation <strong>of</strong> each layer are assigned in MODFLOW toeach <strong>of</strong> the model cells. The hydrostratigraphic layers are assigned to be consistent with the regional conceptualhydrogeologic model and represent three overburden layers and five bedrock layers.The HSP-F model was calibrated to estimate recharge rates (specified flux) for input into the top layer <strong>of</strong> theMODFLOW model. HSP-F calibration efforts were focused on the low flow regime to be able to better constrain thegroundwater recharge estimates. The resulting calibrated average annual recharge estimates ranged from a low <strong>of</strong>0 mm/yr where groundwater discharges to some wetlands to a high <strong>of</strong> 317 mm/yr on the Orangeville Moraine.


