GTMB 7 - Gene Therapy & Molecular Biology
GTMB 7 - Gene Therapy & Molecular Biology
GTMB 7 - Gene Therapy & Molecular Biology

You also want an ePaper? Increase the reach of your titles
YUMPU automatically turns print PDFs into web optimized ePapers that Google loves.
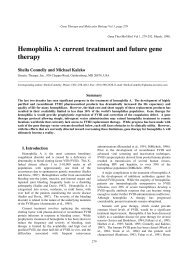
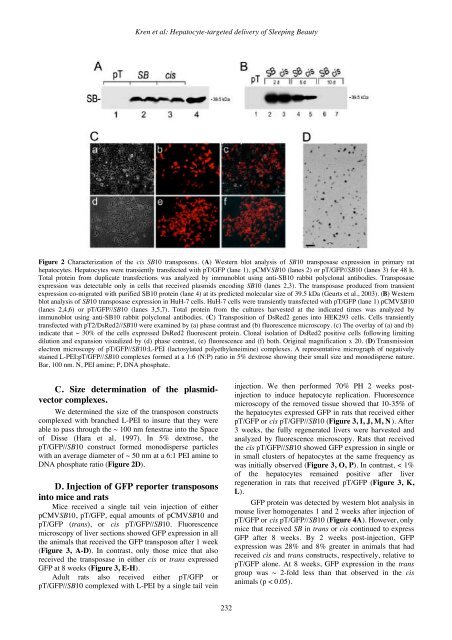
Kren et al: Hepatocyte-targeted delivery of Sleeping BeautyFigure 2 Characterization of the cis SB10 transposons. (A) Western blot analysis of SB10 transposase expression in primary rathepatocytes. Hepatocytes were transiently transfected with pT/GFP (lane 1), pCMVSB10 (lanes 2) or pT/GFP//SB10 (lanes 3) for 48 h.Total protein from duplicate transfections was analyzed by immunoblot using anti-SB10 rabbit polyclonal antibodies. Transposaseexpression was detectable only in cells that received plasmids encoding SB10 (lanes 2,3). The transposase produced from transientexpression co-migrated with purified SB10 protein (lane 4) at its predicted molecular size of 39.5 kDa (Geurts et al., 2003). (B) Westernblot analysis of SB10 transposase expression in HuH-7 cells. HuH-7 cells were transiently transfected with pT/GFP (lane 1) pCMVSB10(lanes 2,4,6) or pT/GFP//SB10 (lanes 3,5,7). Total protein from the cultures harvested at the indicated times was analyzed byimmunoblot using anti-SB10 rabbit polyclonal antibodies. (C) Transposition of DsRed2 genes into HEK293 cells. Cells transientlytransfected with pT2/DsRed2//SB10 were examined by (a) phase contrast and (b) fluorescence microscopy. (c) The overlay of (a) and (b)indicate that ~ 30% of the cells expressed DsRed2 fluorescent protein. Clonal isolation of DsRed2 positive cells following limitingdilution and expansion visualized by (d) phase contrast, (e) fluorescence and (f) both. Original magnification x 20. (D) Transmissionelectron microscopy of pT/GFP//SB10:L-PEI (lactosylated polyethyleneimine) complexes. A representative micrograph of negativelystained L-PEI:pT/GFP//SB10 complexes formed at a 1:6 (N:P) ratio in 5% dextrose showing their small size and monodisperse nature.Bar, 100 nm. N, PEI amine; P, DNA phosphate.C. Size determination of the plasmidvectorcomplexes.We determined the size of the transposon constructscomplexed with branched L-PEI to insure that they wereable to pass through the ~ 100 nm fenestrae into the Spaceof Disse (Hara et al, 1997). In 5% dextrose, thepT/GFP//SB10 construct formed monodisperse particleswith an average diameter of ~ 50 nm at a 6:1 PEI amine toDNA phosphate ratio (Figure 2D).D. Injection of GFP reporter transposonsinto mice and ratsMice received a single tail vein injection of eitherpCMVSB10, pT/GFP, equal amounts of pCMVSB10 andpT/GFP (trans), or cis pT/GFP//SB10. Fluorescencemicroscopy of liver sections showed GFP expression in allthe animals that received the GFP transposon after 1 week(Figure 3, A-D). In contrast, only those mice that alsoreceived the transposase in either cis or trans expressedGFP at 8 weeks (Figure 3, E-H).Adult rats also received either pT/GFP orpT/GFP//SB10 complexed with L-PEI by a single tail veininjection. We then performed 70% PH 2 weeks postinjectionto induce hepatocyte replication. Fluorescencemicroscopy of the removed tissue showed that 10-35% ofthe hepatocytes expressed GFP in rats that received eitherpT/GFP or cis pT/GFP//SB10 (Figure 3, I, J, M, N). After3 weeks, the fully regenerated livers were harvested andanalyzed by fluorescence microscopy. Rats that receivedthe cis pT/GFP//SB10 showed GFP expression in single orin small clusters of hepatocytes at the same frequency aswas initially observed (Figure 3, O, P). In contrast, < 1%of the hepatocytes remained positive after liverregeneration in rats that received pT/GFP (Figure 3, K,L).GFP protein was detected by western blot analysis inmouse liver homogenates 1 and 2 weeks after injection ofpT/GFP or cis pT/GFP//SB10 (Figure 4A). However, onlymice that received SB in trans or cis continued to expressGFP after 8 weeks. By 2 weeks post-injection, GFPexpression was 28% and 8% greater in animals that hadreceived cis and trans constructs, respectively, relative topT/GFP alone. At 8 weeks, GFP expression in the transgroup was ~ 2-fold less than that observed in the cisanimals (p < 0.05).232