GTMB 7 - Gene Therapy & Molecular Biology
GTMB 7 - Gene Therapy & Molecular Biology
GTMB 7 - Gene Therapy & Molecular Biology

You also want an ePaper? Increase the reach of your titles
YUMPU automatically turns print PDFs into web optimized ePapers that Google loves.
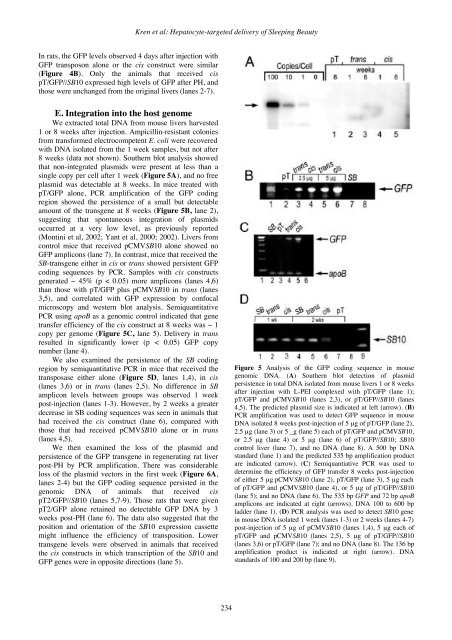
Kren et al: Hepatocyte-targeted delivery of Sleeping BeautyIn rats, the GFP levels observed 4 days after injection withGFP transposon alone or the cis construct were similar(Figure 4B). Only the animals that received cispT/GFP//SB10 expressed high levels of GFP after PH, andthose were unchanged from the original livers (lanes 2-7).E. Integration into the host genomeWe extracted total DNA from mouse livers harvested1 or 8 weeks after injection. Ampicillin-resistant coloniesfrom transformed electrocompetent E. coli were recoveredwith DNA isolated from the 1 week samples, but not after8 weeks (data not shown). Southern blot analysis showedthat non-integrated plasmids were present at less than asingle copy per cell after 1 week (Figure 5A), and no freeplasmid was detectable at 8 weeks. In mice treated withpT/GFP alone, PCR amplification of the GFP codingregion showed the persistence of a small but detectableamount of the transgene at 8 weeks (Figure 5B, lane 2),suggesting that spontaneous integration of plasmidsoccurred at a very low level, as previously reported(Montini et al, 2002; Yant et al, 2000; 2002). Livers fromcontrol mice that received pCMVSB10 alone showed noGFP amplicons (lane 7). In contrast, mice that received theSB-transgene either in cis or trans showed persistent GFPcoding sequences by PCR. Samples with cis constructsgenerated ~ 45% (p < 0.05) more amplicons (lanes 4,6)than those with pT/GFP plus pCMVSB10 in trans (lanes3,5), and correlated with GFP expression by confocalmicroscopy and western blot analysis. SemiquantitativePCR using apoB as a genomic control indicated that genetransfer efficiency of the cis construct at 8 weeks was ~ 1copy per genome (Figure 5C, lane 5). Delivery in transresulted in significantly lower (p < 0.05) GFP copynumber (lane 4).We also examined the persistence of the SB codingregion by semiquantitative PCR in mice that received thetransposase either alone (Figure 5D, lanes 1,4), in cis(lanes 3,6) or in trans (lanes 2,5). No difference in SBamplicon levels between groups was observed 1 weekpost-injection (lanes 1-3). However, by 2 weeks a greaterdecrease in SB coding sequences was seen in animals thathad received the cis construct (lane 6), compared withthose that had received pCMVSB10 alone or in trans(lanes 4,5).We then examined the loss of the plasmid andpersistence of the GFP transgene in regenerating rat liverpost-PH by PCR amplification. There was considerableloss of the plasmid vectors in the first week (Figure 6A,lanes 2-4) but the GFP coding sequence persisted in thegenomic DNA of animals that received cispT2/GFP//SB10 (lanes 5,7-9). Those rats that were givenpT2/GFP alone retained no detectable GFP DNA by 3weeks post-PH (lane 6). The data also suggested that theposition and orientation of the SB10 expression cassettemight influence the efficiency of transposition. Lowertransgene levels were observed in animals that receivedthe cis constructs in which transcription of the SB10 andGFP genes were in opposite directions (lane 5).Figure 5 Analysis of the GFP coding sequence in mousegenomic DNA. (A) Southern blot detection of plasmidpersistence in total DNA isolated from mouse livers 1 or 8 weeksafter injection with L-PEI complexed with pT/GFP (lane 1);pT/GFP and pCMVSB10 (lanes 2,3), or pT/GFP//SB10 (lanes4,5). The predicted plasmid size is indicated at left (arrow). (B)PCR amplification was used to detect GFP sequence in mouseDNA isolated 8 weeks post-injection of 5 µg of pT/GFP (lane 2),2.5 µg (lane 3) or 5 _g (lane 5) each of pT/GFP and pCMVSB10,or 2.5 µg (lane 4) or 5 µg (lane 6) of pT/GFP//SB10; SB10control liver (lane 7), and no DNA (lane 8). A 500 bp DNAstandard (lane 1) and the predicted 535 bp amplification productare indicated (arrow). (C) Semiquantiative PCR was used todetermine the efficiency of GFP transfer 8 weeks post-injectionof either 5 µg pCMVSB10 (lane 2), pT/GFP (lane 3), 5 µg eachof pT/GFP and pCMVSB10 (lane 4), or 5 µg of pT/GFP//SB10(lane 5); and no DNA (lane 6). The 535 bp GFP and 72 bp apoBamplicons are indicated at right (arrows). DNA 100 to 600 bpladder (lane 1). (D) PCR analysis was used to detect SB10 genein mouse DNA isolated 1 week (lanes 1-3) or 2 weeks (lanes 4-7)post-injection of 5 µg of pCMVSB10 (lanes 1,4), 5 µg each ofpT/GFP and pCMVSB10 (lanes 2,5), 5 µg of pT/GFP//SB10(lanes 3,6) or pT/GFP (lane 7); and no DNA (lane 8). The 136 bpamplification product is indicated at right (arrow). DNAstandards of 100 and 200 bp (lane 9).234