- Page 4 and 5:
Cover Artwork: Long-tailed Blue But
- Page 7 and 8:
LIST OF FIGURESFigure 1. Gross Dome
- Page 9 and 10:
Figure 41. Number of Students Invol
- Page 11 and 12:
Figure 85. Proportion of Babies Bor
- Page 13 and 14:
Figure 127. Relationship Between th
- Page 15:
Table 21. Policy Documents Relevant
- Page 19:
Table 108. Proportion of Young Peop
- Page 23 and 24:
INTRODUCTION AND OVERVIEWIntroducti
- Page 25 and 26:
three then reviews mental health is
- Page 27 and 28:
Table 1. Overview of the Determinan
- Page 29 and 30:
Stream Indicator New Zealand Distri
- Page 31 and 32: Stream Indicator New Zealand Distri
- Page 33 and 34: Stream Indicator New Zealand Distri
- Page 35 and 36: Stream Indicator New Zealand Distri
- Page 37 and 38: Stream Indicator New Zealand Distri
- Page 39 and 40: Stream Indicator New Zealand Distri
- Page 41 and 42: Stream Indicator New Zealand Distri
- Page 43: Stream Indicator New Zealand Distri
- Page 47: 47MACROECONOMICINDICATORS
- Page 50 and 51: Expenditure-based Measure of GDPThe
- Page 52 and 53: Gini Coefficient: The Lorenz curve
- Page 54 and 55: CHILD POVERTY AND LIVING STANDARDSI
- Page 56 and 57: After Housing Costs (AHC)Relative P
- Page 58 and 59: Figure 8. Proportion of Dependent C
- Page 60 and 61: 14 Items (Enforced Lacks) are inclu
- Page 62 and 63: Local Policy Documents and Evidence
- Page 64 and 65: Other Relevant New Zealand Evidence
- Page 66 and 67: UNEMPLOYMENT RATESIntroductionIn th
- Page 68 and 69: Figure 12. Unemployment Rates by Ag
- Page 70 and 71: Unemployment Rates by Qualification
- Page 72 and 73: Figure 18. Quarterly Unemployment R
- Page 74 and 75: CHILDREN RELIANT ON BENEFIT RECIPIE
- Page 76 and 77: Table 4. Number of Children Aged 0-
- Page 78 and 79: Table 5. Number of Children Aged 0-
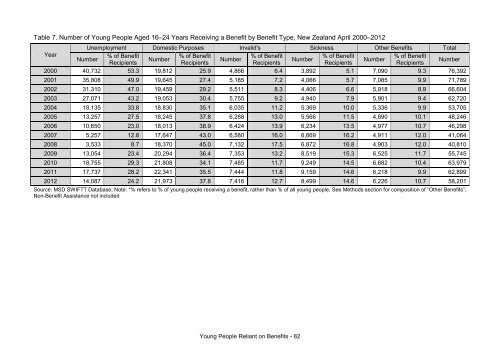
- Page 80 and 81: YOUNG PEOPLE RELIANT ON BENEFITSInt
- Page 84 and 85: New Zealand Distribution by Ethnici
- Page 86 and 87: Figure 25. Young People Aged 16-24
- Page 88 and 89: Table 10. Number of Young People Ag
- Page 91: HOUSEHOLD COMPOSITION91
- Page 94 and 95: Data Source and MethodsDefinitionPr
- Page 96 and 97: Figure 29. Proportion of Children A
- Page 98 and 99: Robertson J, et al. 2006. Review of
- Page 100 and 101: Canadian National Occupancy Standar
- Page 102 and 103: Figure 33. Proportion of Children a
- Page 104 and 105: Other Relevant EvidenceMarmot Revie
- Page 106 and 107: 106
- Page 108 and 109: 108
- Page 110 and 111: Note 2: The number of new school en
- Page 112 and 113: Figure 36. Proportion of New Entran
- Page 114 and 115: Local Policy Documents and Evidence
- Page 116 and 117: Sylva K, et al. 2004 The Effective
- Page 118 and 119: Table 15. Enrolments in Māori Medi
- Page 120 and 121: Table 16. Number of Students (Māor
- Page 122 and 123: Local Policy Documents which Consid
- Page 124 and 125: HIGHEST EDUCATIONAL ATTAINMENT AT S
- Page 126 and 127: Figure 43. Highest Educational Atta
- Page 128 and 129: Figure 46. Highest Educational Atta
- Page 130 and 131: Local Policy Documents and Evidence
- Page 132 and 133:
SENIOR SECONDARY SCHOOL RETENTION A
- Page 134 and 135:
Participation in Tertiary Education
- Page 136 and 137:
Midland Region Distribution and Tre
- Page 138 and 139:
The following section uses informat
- Page 140 and 141:
Figure 54. Age-Standardised Rates o
- Page 142 and 143:
Figure 56. Age-Standardised School
- Page 144 and 145:
Local Policy Documents and Evidence
- Page 146 and 147:
TRUANCY AND UNJUSTIFIED ABSENCESInt
- Page 148 and 149:
Figure 60. Total Unjustified Absenc
- Page 150 and 151:
Figure 63. Total Unjustified Absenc
- Page 152 and 153:
152
- Page 154 and 155:
154
- Page 156 and 157:
156
- Page 158 and 159:
Table 22. The National Immunisation
- Page 160 and 161:
Figure 64. Immunisation Coverage by
- Page 162:
Figure 67. Immunisation Coverage by
- Page 165 and 166:
Figure 71. Immunisation Coverage at
- Page 167 and 168:
Soares-Weiser K, et al. 2012. Vacci
- Page 169 and 170:
Briss PA, et al. 2000. Reviews of e
- Page 171 and 172:
Data Sources and MethodsIndicatorPr
- Page 173 and 174:
Figure 75. Proportion of New Zealan
- Page 175 and 176:
Proportion Receiving Core Contacts
- Page 177 and 178:
Figure 81. Proportion of Babies who
- Page 179 and 180:
The B4 School CheckThe B4 School Ch
- Page 181 and 182:
Local Policy Documents and Evidence
- Page 183 and 184:
Other Relevant EvidenceThe Scottish
- Page 185 and 186:
185SUBSTANCE USE
- Page 188 and 189:
Notes on InterpretationNote 1: The
- Page 190 and 191:
Maternal Smoking at First Registrat
- Page 192 and 193:
Figure 86. Proportion of Babies Bor
- Page 194 and 195:
Table 32. Number of Cigarettes Smok
- Page 196 and 197:
Figure 88. Proportion of Babies Bor
- Page 198 and 199:
National Institute for Health and C
- Page 200 and 201:
2. Proportion of babies born to mot
- Page 202 and 203:
Figure 90. Proportion of Babies Bor
- Page 204 and 205:
Table 37. Number of Cigarettes Smok
- Page 206 and 207:
Figure 92. Proportion of Babies Bor
- Page 208 and 209:
Figure 93. Proportion of Year 10 St
- Page 210 and 211:
Figure 95. Proportion of Year 10 St
- Page 212 and 213:
TOBACCO USE IN YOUNG PEOPLEIntroduc
- Page 214 and 215:
Figure 96. Daily Smoking Rates in Y
- Page 216 and 217:
2009 New Zealand Tobacco Use Survey
- Page 218 and 219:
Source of Tobacco in the Last Month
- Page 220 and 221:
Carson KV, et al. 2011. Community i
- Page 222 and 223:
Other Relevant PublicationsMāori A
- Page 224 and 225:
Other Cochrane Systematic Reviews o
- Page 226 and 227:
ALCOHOL-RELATED HOSPITAL ADMISSIONS
- Page 228 and 229:
Figure 100. Alcohol-Related Hospita
- Page 230 and 231:
Table 45. Listed External Causes of
- Page 232 and 233:
Midland Region Distribution and Tre
- Page 234 and 235:
Local Policy Documents and Evidence
- Page 236 and 237:
Shults RA, et al. 2009. Effectivene
- Page 238 and 239:
238
- Page 240 and 241:
240
- Page 242 and 243:
242
- Page 244 and 245:
Mortality from conditions with a so
- Page 246 and 247:
Table 50. Mortality from Conditions
- Page 248 and 249:
Figure 105. Hospital Admissions for
- Page 250 and 251:
Midland Region Distribution and Tre
- Page 252 and 253:
Table 55. Hospital Admissions for C
- Page 254 and 255:
Table 57. Hospital Admissions for C
- Page 256 and 257:
Midland Region Distribution by Caus
- Page 258 and 259:
Figure 107. Hospital Admissions for
- Page 260 and 261:
INFANT MORTALITY AND SUDDEN UNEXPEC
- Page 262 and 263:
New Zealand Distribution and Trends
- Page 264 and 265:
Figure 111. Total Infant Mortality,
- Page 266 and 267:
Table 62. Neonatal and Post Neonata
- Page 268 and 269:
Table 65. Neonatal and Post Neonata
- Page 270 and 271:
Distribution by Ethnicity, NZ Depri
- Page 272 and 273:
Figure 116. Sudden Unexpected Death
- Page 274 and 275:
Vennemann M, et al. 2007. Do immuni
- Page 276 and 277:
276
- Page 278 and 279:
with a review of interventions aime
- Page 280 and 281:
deprivation in some parts of the wo
- Page 282 and 283:
who delay a second pregnancy by two
- Page 284 and 285:
Family ViolenceDefinitions and New
- Page 286 and 287:
need for multidisciplinary interven
- Page 288 and 289:
6 days to determine gestational age
- Page 290 and 291:
In New Zealand, information on fact
- Page 292 and 293:
post intervention. Engagement in ed
- Page 294 and 295:
antenatal care, including two nutri
- Page 296 and 297:
throughout pregnancy, birth and the
- Page 298 and 299:
Alcohol and Other DrugsNational and
- Page 300 and 301:
Zealand had a number of specialist
- Page 302 and 303:
in one Cochrane review [274] (see p
- Page 304 and 305:
interventions to treat antenatal de
- Page 306 and 307:
In ConclusionWhile it is hoped that
- Page 308 and 309:
308
- Page 310 and 311:
Data Source and MethodsDefinition1.
- Page 312 and 313:
Figure 119. Hospital Admissions for
- Page 314 and 315:
Midland Region Distribution and Tre
- Page 316 and 317:
Local Policy Documents and Evidence
- Page 318 and 319:
Other Systematic ReviewsLouwers ECF
- Page 320 and 321:
INJURIES ARISING FROM ASSAULT IN YO
- Page 322 and 323:
New Zealand Distribution by Age and
- Page 324 and 325:
Midland Region Distribution and Tre
- Page 326 and 327:
Local Policy Documents and Evidence
- Page 328 and 329:
Flood M & Fergus L. 2008. An Assaul
- Page 330 and 331:
Note 2: The numbers in this section
- Page 332 and 333:
Table 78. Number of Notifications t
- Page 334 and 335:
Table 80. Outcome of Assessment for
- Page 336 and 337:
Table 82. Number of Notifications R
- Page 338 and 339:
Table 84. Outcome of Assessment for
- Page 340 and 341:
Data Source and MethodsDefinition1.
- Page 342 and 343:
Family Violence Investigations Wher
- Page 344 and 345:
Table 90. Local Policy Documents an
- Page 346 and 347:
Stover CS, et al. 2009. Interventio
- Page 348 and 349:
348
- Page 350 and 351:
350
- Page 352 and 353:
oader contextual influences on the
- Page 354 and 355:
In addition, Table 112 on Page 414
- Page 356 and 357:
Williams SB, et al. 2009. Screening
- Page 358 and 359:
Ministries of Education, Health, Ju
- Page 360 and 361:
Figure 129. Children and Young Peop
- Page 362 and 363:
Table 92. Children Aged 0-14 Years
- Page 364 and 365:
Table 94. Children Aged 0-14 Years
- Page 366 and 367:
Table 95. Children Aged 0-14 Years
- Page 368 and 369:
IN-DEPTH TOPIC: MENTAL HEALTH ISSUE
- Page 370 and 371:
this [350]. The review stated that
- Page 372 and 373:
psychotic disorders including first
- Page 374 and 375:
Social Workers in SchoolsIn 2011 th
- Page 376 and 377:
Children or young people with sever
- Page 378 and 379:
EpidemiologyThe 2009 review by Meri
- Page 380 and 381:
A diagnosis of conduct disorder acc
- Page 382 and 383:
programme using a questionnaire. Si
- Page 384 and 385:
developmentally appropriate diagnos
- Page 386 and 387:
playthings or the environment, appe
- Page 388 and 389:
state more than it cost) provided t
- Page 390 and 391:
ACCESS TO MENTAL HEALTH SERVICES: L
- Page 392 and 393:
Table 97. Children and Young People
- Page 394 and 395:
Midland Region DistributionChildren
- Page 396 and 397:
ACCESS TO MENTAL HEALTH SERVICES: L
- Page 398 and 399:
Table 101. Hospital Admissions for
- Page 400 and 401:
Numbers Accessing Services by Diagn
- Page 402 and 403:
Table 103. Young People Aged 15-24
- Page 404 and 405:
Table 105. Young People Aged 15-24
- Page 406 and 407:
Table 107. Young People Aged 15-24
- Page 408 and 409:
Table 108. Proportion of Young Peop
- Page 410 and 411:
Table 110. Young People Aged 15-24
- Page 412 and 413:
Midland Region DistributionAmongst
- Page 414 and 415:
Local Policy Documents and Evidence
- Page 416 and 417:
Fletcher A, et al. 2008. School Eff
- Page 418 and 419:
New Zealand Distribution and Trends
- Page 420 and 421:
Figure 138. Mortality from Suicide
- Page 422 and 423:
Figure 139. Mortality from Suicide
- Page 424 and 425:
Ougrin D & Latif S. 2011. Specific
- Page 426 and 427:
426
- Page 428 and 429:
428
- Page 430 and 431:
Guide to Community Preventive Servi
- Page 432 and 433:
information on all of the events oc
- Page 434 and 435:
3. In addition, some providers admi
- Page 436 and 437:
as in the majority of the analyses
- Page 438 and 439:
APPENDIX 5: THE NATIONAL MORTALITYC
- Page 440 and 441:
As a result of these changes, there
- Page 442 and 443:
2. Research also suggests that ethn
- Page 444 and 445:
APPENDIX 8: POLICE AREA BOUNDARIESF
- Page 446 and 447:
Figure 142. Police Area Boundaries
- Page 448 and 449:
3. The condition exhibits a socioec
- Page 450 and 451:
REFERENCES1. Children's Commissione
- Page 452 and 453:
33. Mackay R. 2005. The Impact of F
- Page 454 and 455:
71. Ministry of Health. 2011. Immun
- Page 456 and 457:
107. ASH New Zealand. 2011. Nationa
- Page 458 and 459:
141. Child and Youth Mortality Revi
- Page 460 and 461:
175. Pihama L. 2011. Overview of M
- Page 462 and 463:
208. King-Hele S, Webb RT, Mortense
- Page 464 and 465:
244. Nelson Marlborough District He
- Page 466 and 467:
274. Ramsay J, Carter Y, Davidson L
- Page 468 and 469:
306. Jewkes R. 2002. Intimate partn
- Page 470 and 471:
347. Heflinger CA, Hinshaw SP. 2010
- Page 472 and 473:
376. Ministry of Education. 2012. W
- Page 474 and 475:
410. Ministry of Health. 2001. New
- Page 476 and 477:
443. Zeanah PD, Bailey LO, Berry S.
- Page 478 and 479:
480. Weinberg MK, Olson KL, Beeghly


