- Page 4 and 5:
6. The 2012 Olympics will provide a
- Page 6 and 7:
500 completed responses were receiv
- Page 8 and 9:
22. It is worth noting that no swim
- Page 10 and 11:
Key Objectives up to 2016 Prioritie
- Page 12 and 13:
Key Objectives up to 2016 Prioritie
- Page 14:
• Local - primary schools, commun
- Page 20 and 21:
SiteFentonManorFacilitySitePoolHall
- Page 22 and 23:
Central Forest Park Skate park Reta
- Page 24 and 25:
43. Where an existing school is pro
- Page 26 and 27:
Neighbourhood Area ProposalsEastern
- Page 28 and 29:
Northern48. This area has a high pr
- Page 30 and 31:
Other facilities - location not yet
- Page 32 and 33:
Site Facility Proposal to meet comm
- Page 34 and 35:
Mount PleasantParkTennis courtsPlay
- Page 36 and 37:
Western58. This area has more young
- Page 38 and 39:
Next Steps61. The Strategy facility
- Page 40 and 41:
Nortoft Partnerships Ltd3 Ryehills
- Page 42 and 43:
TABLE OF CONTENTSSECTION 1: .......
- Page 44 and 45:
SECTION 1:BACKGROUND AND CONTEXTInt
- Page 46 and 47:
on-Trent strives to achieve. The ma
- Page 48 and 49:
Strategic Direction16. The objectiv
- Page 50 and 51:
Figure 1:Neighbourhood Management A
- Page 52 and 53:
26. For the purposes of this report
- Page 54 and 55:
32. It is known that deprivation ha
- Page 56 and 57:
helping to explain variations in so
- Page 58 and 59:
NB: Walking and cycling is recreati
- Page 60 and 61:
those who are looked after. After o
- Page 62 and 63:
Figure 11:Top five market segments
- Page 64 and 65:
52. More detail about the main spor
- Page 66 and 67:
57. However, the figure does not ta
- Page 68 and 69:
8. Brief interventions: the need to
- Page 70 and 71:
NHS Stoke-on- Tren
- Page 72 and 73:
Economic regeneration76. The econom
- Page 74 and 75:
• Guiding sub-regional strategic
- Page 76 and 77:
SECTION 2SPORTS DEVELOPMENT &PHYSIC
- Page 78 and 79:
SECTION 2:SPORTS DEVELOPMENT AND PH
- Page 80 and 81:
options. There is also a desire for
- Page 82 and 83:
• Engaging with residents of all
- Page 84 and 85:
• Providing training and advice t
- Page 86 and 87:
• Ensuring that those at greatest
- Page 88 and 89:
such surveys can provide invaluable
- Page 90 and 91:
Figure 1:QUEST accredited sitesNort
- Page 92 and 93:
• Increase the number of major sp
- Page 94 and 95:
Impact of the current economic clim
- Page 96 and 97:
SECTION 3STRATEGY DIRECTION AND TAR
- Page 98 and 99:
SECTION 3:STRATEGY DIRECTION AND TA
- Page 100 and 101:
Key Objectives up to 2016 Prioritie
- Page 102 and 103:
Key Objectives up to 2016 Prioritie
- Page 104 and 105:
Key Objectives up to 2016 Prioritie
- Page 106 and 107:
Key Objectives up to 2016 Prioritie
- Page 108 and 109:
TABLE OF CONTENTSSECTION 4: .......
- Page 110 and 111:
sport and dance clubs. For young pe
- Page 112 and 113:
e alternative types of provision th
- Page 114 and 115:
BSF in Stoke-on-Tr
- Page 116 and 117:
Figure 2:Stoke-on-
- Page 118 and 119:
TABLE OF CONTENTSSECTION 5: .......
- Page 120 and 121:
• Review of National Governing Bo
- Page 122 and 123:
Local Supply and Demand Balance12.
- Page 124 and 125:
Consultation21. The theoretical mod
- Page 126 and 127:
34. Some of the stakeholders reques
- Page 128 and 129:
Strategic Framework for SportsStrat
- Page 130 and 131:
smaller facilities such as the work
- Page 132 and 133:
TABLE OF CONTENTSSECTION 6: .......
- Page 134 and 135:
Consultation ......................
- Page 136 and 137:
Figure 43: Boxing gyms ............
- Page 138 and 139:
The facility hierarchy3. The hierar
- Page 140 and 141:
7. There are two principal types:
- Page 142 and 143:
often on a key-holder basis, or sim
- Page 144 and 145:
Super Hub and Hub Facilities34. The
- Page 146 and 147:
Disability Centre36. Stoke<
- Page 148 and 149:
as being the ‘walking catchment
- Page 150 and 151:
Water space and participationAdult
- Page 152 and 153:
also the subject of a parallel proj
- Page 154 and 155:
Household survey57. The household s
- Page 156 and 157:
Children and Young People’s Surve
- Page 158 and 159:
support swimming provision should t
- Page 160 and 161:
Future provision for community swim
- Page 162 and 163:
LONGTON HSPOOLLONGTON LEISURECENTRE
- Page 164 and 165:
79. Although this network addresses
- Page 166 and 167:
Figure 10:Pools with community use
- Page 168 and 169:
Trent’s pools were able to match
- Page 170 and 171:
• New and refurbished facilities
- Page 172 and 173:
Name of FacilityExistingmanagement(
- Page 174 and 175:
94. The map suggests that, in relat
- Page 176 and 177:
ConsultationE lected Mayor’s Gree
- Page 178 and 179: Children and Young People’s Surve
- Page 180 and 181: • Norton Table Tennis Club is bas
- Page 182 and 183: University. The Fenton Manor site i
- Page 184 and 185: 128. The details of the requirement
- Page 186 and 187: Figure 14:Sports Halls - proposalsN
- Page 188 and 189: Name of FacilityProposalSize (no.Ba
- Page 190 and 191: Standards for new provision130. It
- Page 192 and 193: Synthetic Turf Pitches (STPs)Introd
- Page 194 and 195: • England Hockey permits the use
- Page 196 and 197: Condition of facilities144. STPs re
- Page 198 and 199: 150. As the above map shows travel
- Page 200 and 201: Schools reorganisation programmeBac
- Page 202 and 203: Household Survey162. The main issue
- Page 204 and 205: Figure 20:Large size STPs and typeN
- Page 206 and 207: RecommendationsFacility list171. Ne
- Page 208 and 209: Sports Specific FacilitiesIntroduct
- Page 210 and 211: Athletics Tracks and Indoor Trainin
- Page 212 and 213: 196. Everyone in Stoke</str
- Page 214 and 215: ConsultationNational Governing Body
- Page 216 and 217: north and one site in the south of
- Page 218 and 219: available to registered members. Th
- Page 220 and 221: Assessment222. The table below illu
- Page 222 and 223: Figure 26:Household Survey - health
- Page 224 and 225: Schools reorganisation programme -
- Page 226 and 227: specialist equipment or dedicated t
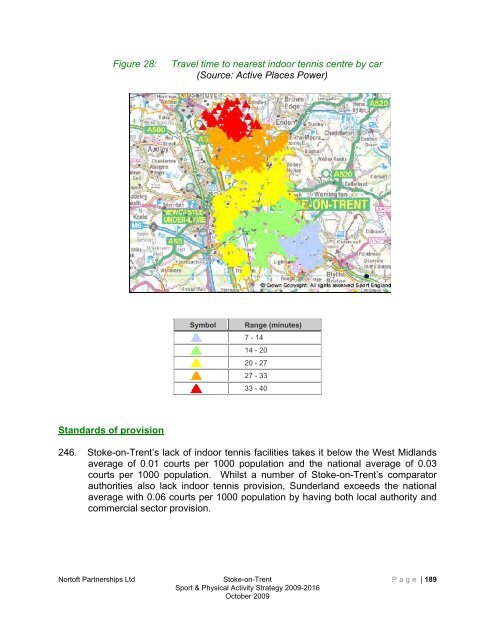
- Page 230 and 231: Figure 29:Tennis - indoor courts in
- Page 232 and 233: Standards of provision and develope
- Page 234 and 235: Figure 30:Outdoor tennis courts in
- Page 236 and 237: Figure 31:Outdoor tennis courts, th
- Page 238 and 239: Figure 32:Household survey - outdoo
- Page 240 and 241: community use), so the current scho
- Page 242 and 243: 285. Improve the quality of the ten
- Page 244 and 245: Standards of provision288. Increase
- Page 246 and 247: Figure 34: Indoor bowls - comparato
- Page 248 and 249: 304. A key issue however will be wh
- Page 250 and 251: 316. The facility to be considered
- Page 252 and 253: Figure 36:Bowling green listName of
- Page 254 and 255: Figure 37:Outdoor bowls greens - qu
- Page 256 and 257: Figure 38:Outdoor bowls - household
- Page 258 and 259: 333. All sites should meet the desi
- Page 260 and 261: secondary school aged, and registra
- Page 262 and 263: Figure 40:Travel time to nearest go
- Page 264 and 265: ConsultationElected Mayor’s Green
- Page 266 and 267: enable the development of more golf
- Page 268 and 269: BoxingSa/LThe main facilities for b
- Page 270 and 271: equipment. These facilities may als
- Page 272 and 273: TriathlonSaVolleyballSaWrestlingSaC
- Page 274 and 275: Figure 44:Squash courtsNortoft Part
- Page 276 and 277: Local Community FacilitiesIntroduct
- Page 278 and 279:
Assessment366. All the centres were
- Page 280 and 281:
371. On average, 10% of people use
- Page 282 and 283:
RecommendationsFacility list380. Wi
- Page 284 and 285:
Children and Young People’s Surve
- Page 286 and 287:
Figure 47:Dance StudiosNortoft Part
- Page 288 and 289:
Figure 48:Martial Arts FacilitiesNo
- Page 290 and 291:
Skate Parks and Sports Courts/Multi
- Page 292 and 293:
Figure 50:Sports Courts/MUGAs with
- Page 294 and 295:
Sports courts and MUGAs415. A total
- Page 296 and 297:
Figure 52:Activities enjoyed by chi
- Page 298 and 299:
Recommendations431. Existing facili
- Page 300 and 301:
esponse to the growing interest in
- Page 302 and 303:
programme(s) offered and the staff
- Page 304 and 305:
Existing facilitiesFacilityDimensio
- Page 306 and 307:
TABLE OF CONTENTSSECTION 7: .......
- Page 308 and 309:
SECTION 7:PLAYING PITCH STRATEGYInt
- Page 310 and 311:
Figure 1: Overall pattern of change
- Page 312 and 313:
Methodology13. The steps taken to d
- Page 314 and 315:
Table 2:Estimated population for 20
- Page 316 and 317:
The demand for pitches20. A review
- Page 318 and 319:
• An assessment of the balance in
- Page 320 and 321:
Figure 3:Participation in football
- Page 322 and 323:
Figure 4:Clubs with more than 6 tea
- Page 324 and 325:
Figure 5:Football sites with secure
- Page 326 and 327:
Figure 7:Junior Football PitchesNor
- Page 328 and 329:
Grass vs synthetic turf pitches51.
- Page 330 and 331:
Figure 9: Forecast balance in suppl
- Page 332 and 333:
Figure 10:School sites and pitchesS
- Page 334 and 335:
Provision by area71. The area summa
- Page 336 and 337:
74. The issues associated with the
- Page 338 and 339:
Figure 14:Football sites in Norther
- Page 340 and 341:
Figure 15:Forecast balance in suppl
- Page 342 and 343:
Figure 16:Football sites in South E
- Page 344 and 345:
Figure 18:Football sites in South W
- Page 346 and 347:
Figure 20:Football sites in Western
- Page 348 and 349:
Football Site Quality and Managemen
- Page 350 and 351:
Standards of provision for football
- Page 352 and 353:
Figure 21:Cricket PitchesNortoft Pa
- Page 354 and 355:
119. This comparison shows that the
- Page 356 and 357:
126. Staffordshire Cricket’s Faci
- Page 358 and 359:
Balance in supply and demand131. In
- Page 360 and 361:
Burslem, JG Meakins and Norton Cric
- Page 362 and 363:
South Western143. There are current
- Page 364 and 365:
Rugby UnionOverall152. There are fo
- Page 366 and 367:
Figure 25:Rugby sites in and around
- Page 368 and 369:
157. Figure 26 summaries the positi
- Page 370 and 371:
160. The following projects in <str
- Page 372 and 373:
Planning policies170. The following
- Page 374 and 375:
Determining the value of off-site c
- Page 376 and 377:
• The pitches to be used by the c
- Page 378 and 379:
anticipated including the publishin
- Page 380 and 381:
Community UseageSenior FootballJuni
- Page 382 and 383:
TABLE OF CONTENTSSECTION 8: .......
- Page 384 and 385:
Summary of facility proposals5. The
- Page 386 and 387:
Site Facility Proposal to meet comm
- Page 388 and 389:
Site Facility Proposal to meet comm
- Page 390 and 391:
Figure 3:Other facility proposalsOt
- Page 392:
Review and monitoring7. The Strateg


