- Page 1 and 2:
HUMAN DEVELOPMENT IN INDIAUMANEVELO
- Page 4 and 5:
HUMAN DEVELOPMENT IN INDIAHUMANDEVE
- Page 6:
ToThe 41,554 households who partici
- Page 9 and 10:
viiicontentsSOCIAL CHANGES11. Socia
- Page 11 and 12:
x tables, figures, and boxes6.1 Enr
- Page 13 and 14:
xiitables, figures, and boxes6.1a L
- Page 16 and 17:
ForewordIndia has been fortunate as
- Page 18 and 19:
PrefaceOn account of the size of it
- Page 20:
acknowledgements xixWhile space doe
- Page 23 and 24:
xxii research team and advisorsO.P.
- Page 25 and 26:
AbbreviationsASERBPLCHCDPTFPSHCRHDI
- Page 28 and 29:
1IntroductionLong years ago we made
- Page 30 and 31:
introduction 5the agricultural stag
- Page 32:
introduction 7on income points out,
- Page 36 and 37:
2Income, Poverty, and InequalityAs
- Page 38 and 39:
income, poverty, and inequality 13t
- Page 40 and 41:
income, poverty, and inequality 15A
- Page 42 and 43:
income, poverty, and inequality 173
- Page 44 and 45:
income, poverty, and inequality 19R
- Page 46 and 47:
income, poverty, and inequality 21T
- Page 48 and 49:
income, poverty, and inequality 23D
- Page 50 and 51:
income, poverty, and inequality 25T
- Page 52 and 53:
income, poverty, and inequality 27T
- Page 54 and 55:
agriculture 29Figure 3.1Source: IHD
- Page 56 and 57:
agriculture 31Figure 3.2bSource: IH
- Page 58 and 59:
agriculture 33other religious minor
- Page 60 and 61:
agriculture 35Figure 3.5Source: IHD
- Page 62 and 63:
agriculture 37Table A.3.1aCultivati
- Page 64 and 65: 4EmploymentChapter 2 noted tremendo
- Page 66 and 67: employment 41Box 4.1Education Does
- Page 68 and 69: employment 43in urban areas, animal
- Page 70 and 71: employment 45not surprising that Ta
- Page 72 and 73: employment 47These agricultural and
- Page 74 and 75: employment 49Table A.4.1a Work Part
- Page 76 and 77: employment 51Table A.4.2a: Number o
- Page 78 and 79: employment 53Table A.4.3a: Type of
- Page 80 and 81: employment 55Table A.4.3b: Statewis
- Page 82 and 83: employment 57Table A.4.4b: Statewis
- Page 84 and 85: employment 59Table A.4.5b: Statewis
- Page 86 and 87: household assets and amenities 61WA
- Page 88 and 89: household assets and amenities 63Bo
- Page 90 and 91: household assets and amenities 65Fi
- Page 92 and 93: household assets and amenities 67an
- Page 94 and 95: household assets and amenities 69Bo
- Page 96: household assets and amenities 71Ta
- Page 100 and 101: 6EducationThe chapters on income (C
- Page 102 and 103: education 77Figure 6.1aSource: IHDS
- Page 104 and 105: education 7995 per cent children ag
- Page 106 and 107: education 81Figure 6.3 Educational
- Page 108 and 109: education 836-14 year old, about 40
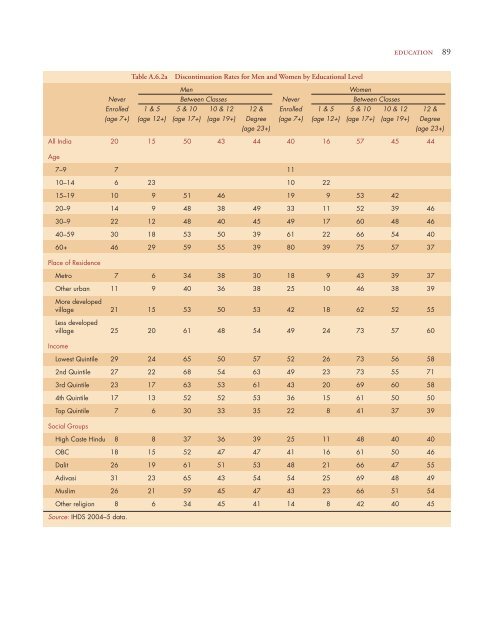
- Page 110 and 111: education 85in a lose-lose situatio
- Page 112 and 113: education 87society. Arithmetic ski
- Page 116 and 117: education 91Table A.6.3a Schooling
- Page 118 and 119: education 93Table A.6.4a Reading, W
- Page 120 and 121: education 95Table A.6.5a Skill Leve
- Page 122 and 123: 7Health and Medical CareThroughout
- Page 124 and 125: health and medical care 99Box 7.1Al
- Page 126 and 127: health and medical care 101Figure 7
- Page 128 and 129: health and medical care 103Source:
- Page 130 and 131: health and medical care 105Figure 7
- Page 132 and 133: health and medical care 107Medical
- Page 134 and 135: health and medical care 109Sixty ni
- Page 136 and 137: health and medical care 111increase
- Page 138 and 139: health and medical care 113Figure 7
- Page 140 and 141: health and medical care 115Box 7.3T
- Page 142 and 143: health and medical care 117Table A.
- Page 144 and 145: health and medical care 119Table A.
- Page 146: health and medical care 121Table A.
- Page 150 and 151: 8Child Well-beingThe well-being of
- Page 152 and 153: child well-being 127privileged and
- Page 154 and 155: child well-being 129Source: IHDS 20
- Page 156 and 157: child well-being 131age. Our result
- Page 158 and 159: child well-being 133Table A.8.1a In
- Page 160 and 161: child well-being 135Table A.8.2bSta
- Page 162 and 163: child well-being 137Table A.8.3bSta
- Page 164 and 165:
well-being of the older population
- Page 166 and 167:
well-being of the older population
- Page 168 and 169:
well-being of the older population
- Page 170 and 171:
well-being of the older population
- Page 172 and 173:
well-being of the older population
- Page 174 and 175:
gender and family dynamics 149Not s
- Page 176 and 177:
gender and family dynamics 151withi
- Page 178 and 179:
gender and family dynamics 153monet
- Page 180 and 181:
gender and family dynamics 155DISCU
- Page 182 and 183:
gender and family dynamics 157Table
- Page 184 and 185:
gender and family dynamics 159Table
- Page 186 and 187:
gender and family dynamics 161Table
- Page 188 and 189:
gender and family dynamics 163Table
- Page 190 and 191:
gender and family dynamics 165Table
- Page 192:
gender and family dynamics 167Table
- Page 196 and 197:
11Social Integration and ExclusionT
- Page 198 and 199:
social integration and exclusion 17
- Page 200 and 201:
social integration and exclusion 17
- Page 202 and 203:
social integration and exclusion 17
- Page 204 and 205:
social integration and exclusion 17
- Page 206 and 207:
social integration and exclusion 18
- Page 208 and 209:
villages in a global world 183mean
- Page 210 and 211:
villages in a global world 185Table
- Page 212 and 213:
villages in a global world 187Table
- Page 214 and 215:
villages in a global world 189Table
- Page 216 and 217:
villages in a global world 191Table
- Page 218:
villages in a global world 193Figur
- Page 222 and 223:
13Social Safety Nets in IndiaPublic
- Page 224 and 225:
social safety nets in india 199Anty
- Page 226 and 227:
social safety nets in india 201THE
- Page 228 and 229:
social safety nets in india 203HIGH
- Page 230 and 231:
social safety nets in india 205(Tab
- Page 232 and 233:
14ConclusionI was again on a great
- Page 234 and 235:
conclusion 209enrolment, it also un
- Page 236 and 237:
conclusion 211availability of work
- Page 238 and 239:
Appendix I—IHDS: The DesignOne of
- Page 240 and 241:
appendix i 215Figure AI.2 India Hum
- Page 242 and 243:
appendix i 217Table AI.1Statewise D
- Page 244 and 245:
appendix i 219(Table AI.2 contd )Ne
- Page 246 and 247:
appendix i 221developed for NSS emp
- Page 248 and 249:
Appendix II—Chapter Organization
- Page 250 and 251:
appendix ii 225(Table AII.1 contd )
- Page 252 and 253:
appendix ii 227will often require t
- Page 254 and 255:
BibliographyAbbas, A.A. and G.J. Wa
- Page 256 and 257:
ibliography 231Blyn, G. (1966). Agr
- Page 258 and 259:
ibliography 233Malik, S. (1979). So


