

Human Development in India - NCAER
Human Development in India - NCAER
Human Development in India - NCAER

Create successful ePaper yourself
Turn your PDF publications into a flip-book with our unique Google optimized e-Paper software.
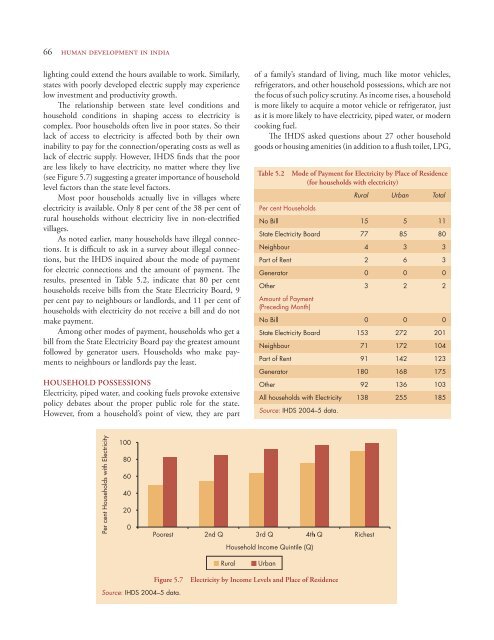
66 human development <strong>in</strong> <strong>in</strong>dialight<strong>in</strong>g could extend the hours available to work. Similarly,states with poorly developed electric supply may experiencelow <strong>in</strong>vestment and productivity growth.The relationship between state level conditions andhousehold conditions <strong>in</strong> shap<strong>in</strong>g access to electricity iscomplex. Poor households often live <strong>in</strong> poor states. So theirlack of access to electricity is affected both by their own<strong>in</strong>ability to pay for the connection/operat<strong>in</strong>g costs as well aslack of electric supply. However, IHDS f<strong>in</strong>ds that the poorare less likely to have electricity, no matter where they live(see Figure 5.7) suggest<strong>in</strong>g a greater importance of householdlevel factors than the state level factors.Most poor households actually live <strong>in</strong> villages whereelectricity is available. Only 8 per cent of the 38 per cent ofrural households without electricity live <strong>in</strong> non-electrifiedvillages.As noted earlier, many households have illegal connections.It is difficult to ask <strong>in</strong> a survey about illegal connections,but the IHDS <strong>in</strong>quired about the mode of paymentfor electric connections and the amount of payment. Theresults, presented <strong>in</strong> Table 5.2, <strong>in</strong>dicate that 80 per centhouseholds receive bills from the State Electricity Board, 9per cent pay to neighbours or landlords, and 11 per cent ofhouseholds with electricity do not receive a bill and do notmake payment.Among other modes of payment, households who get abill from the State Electricity Board pay the greatest amountfollowed by generator users. Households who make paymentsto neighbours or landlords pay the least.HOUSEHOLD POSSESSIONSElectricity, piped water, and cook<strong>in</strong>g fuels provoke extensivepolicy debates about the proper public role for the state.However, from a household’s po<strong>in</strong>t of view, they are partof a family’s standard of liv<strong>in</strong>g, much like motor vehicles,refrigerators, and other household possessions, which are notthe focus of such policy scrut<strong>in</strong>y. As <strong>in</strong>come rises, a householdis more likely to acquire a motor vehicle or refrigerator, justas it is more likely to have electricity, piped water, or moderncook<strong>in</strong>g fuel.The IHDS asked questions about 27 other householdgoods or hous<strong>in</strong>g amenities (<strong>in</strong> addition to a flush toilet, LPG,Table 5.2Per cent HouseholdsMode of Payment for Electricity by Place of Residence(for households with electricity)Rural Urban TotalNo Bill 15 5 11State Electricity Board 77 85 80Neighbour 4 3 3Part of Rent 2 6 3Generator 0 0 0Other 3 2 2Amount of Payment(Preced<strong>in</strong>g Month)No Bill 0 0 0State Electricity Board 153 272 201Neighbour 71 172 104Part of Rent 91 142 123Generator 180 168 175Other 92 136 103All households with Electricity 138 255 185Source: IHDS 2004–5 data.Figure 5.7Source: IHDS 2004–5 data.Electricity by Income Levels and Place of Residence


