<strong>in</strong>come, poverty, and <strong>in</strong>equality 25Table A.2.1b Statewise Household Incomes, Consumption, and PovertyIncome (Rs) Consumption (Rs) % PoorMean Median Mean MedianAll <strong>India</strong> 47,804 27,857 48,706 36,457 25.7Jammu and Kashmir 78,586 51,458 1,02,397 81,232 3.4Himachal Pradesh 68,587 46,684 78,387 56,672 4.3Uttarakhand 49,892 32,962 50,422 40,544 35.7Punjab 73,330 48,150 71,876 60,004 4.9Haryana 74,121 49,942 78,641 59,280 11.3Delhi 87,652 68,250 77,791 62,096 13.9Uttar Pradesh 40,130 24,000 50,313 35,896 33.2Bihar 30,819 20,185 47,731 39,017 NAJharkhand 42,022 24,000 36,579 24,610 49.0Rajasthan 50,479 32,131 51,149 39,396 26.7Chhattisgarh 39,198 23,848 27,972 16,941 63.4Madhya Pradesh 36,152 20,649 39,206 27,604 45.5North-East 82,614 60,000 60,612 43,752 9.8Assam 42,258 25,000 39,268 31,020 24.6West Bengal 46,171 28,051 41,958 31,714 23.1Orissa 28,514 16,500 32,834 22,990 41.3Gujarat 54,707 30,000 53,616 43,832 13.1Maharashtra, Goa 59,930 38,300 50,372 39,502 27.9Andhra Pradesh 39,111 25,600 46,996 37,520 6.8Karnataka 51,809 25,600 53,490 38,074 18.3Kerala 72,669 43,494 52,470 39,952 26.8Tamil Nadu 40,777 26,000 43,966 34,146 18.3Note: NA—not available due to potential measurement errors and/or small sample sizes.Source: IHDS 2004–5 data.
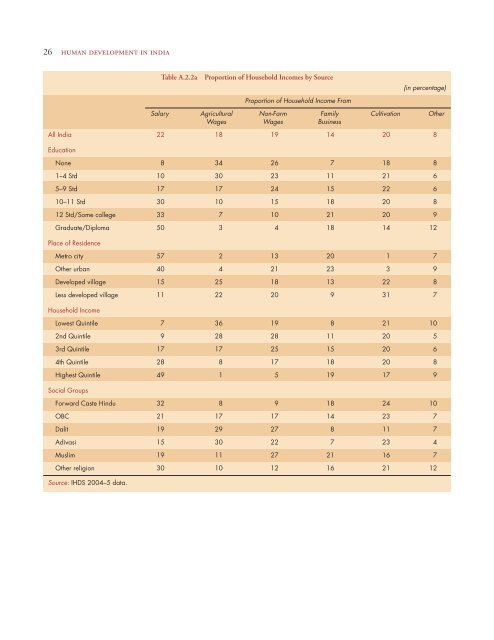
26 human development <strong>in</strong> <strong>in</strong>diaTable A.2.2aProportion of Household Incomes by SourceProportion of Household Income From(<strong>in</strong> percentage)Salary Agricultural Non-Farm Family Cultivation OtherWages Wages Bus<strong>in</strong>essAll <strong>India</strong> 22 18 19 14 20 8EducationNone 8 34 26 7 18 81–4 Std 10 30 23 11 21 65–9 Std 17 17 24 15 22 610–11 Std 30 10 15 18 20 812 Std/Some college 33 7 10 21 20 9Graduate/Diploma 50 3 4 18 14 12Place of ResidenceMetro city 57 2 13 20 1 7Other urban 40 4 21 23 3 9Developed village 15 25 18 13 22 8Less developed village 11 22 20 9 31 7Household IncomeLowest Qu<strong>in</strong>tile 7 36 19 8 21 102nd Qu<strong>in</strong>tile 9 28 28 11 20 53rd Qu<strong>in</strong>tile 17 17 25 15 20 64th Qu<strong>in</strong>tile 28 8 17 18 20 8Highest Qu<strong>in</strong>tile 49 1 5 19 17 9Social GroupsForward Caste H<strong>in</strong>du 32 8 9 18 24 10OBC 21 17 17 14 23 7Dalit 19 29 27 8 11 7Adivasi 15 30 22 7 23 4Muslim 19 11 27 21 16 7Other religion 30 10 12 16 21 12Source: IHDS 2004–5 data.
- Page 1 and 2: HUMAN DEVELOPMENT IN INDIAUMANEVELO
- Page 4 and 5: HUMAN DEVELOPMENT IN INDIAHUMANDEVE
- Page 6: ToThe 41,554 households who partici
- Page 9 and 10: viiicontentsSOCIAL CHANGES11. Socia
- Page 11 and 12: x tables, figures, and boxes6.1 Enr
- Page 13 and 14: xiitables, figures, and boxes6.1a L
- Page 16 and 17: ForewordIndia has been fortunate as
- Page 18 and 19: PrefaceOn account of the size of it
- Page 20: acknowledgements xixWhile space doe
- Page 23 and 24: xxii research team and advisorsO.P.
- Page 25 and 26: AbbreviationsASERBPLCHCDPTFPSHCRHDI
- Page 28 and 29: 1IntroductionLong years ago we made
- Page 30 and 31: introduction 5the agricultural stag
- Page 32: introduction 7on income points out,
- Page 36 and 37: 2Income, Poverty, and InequalityAs
- Page 38 and 39: income, poverty, and inequality 13t
- Page 40 and 41: income, poverty, and inequality 15A
- Page 42 and 43: income, poverty, and inequality 173
- Page 44 and 45: income, poverty, and inequality 19R
- Page 46 and 47: income, poverty, and inequality 21T
- Page 48 and 49: income, poverty, and inequality 23D
- Page 52 and 53: income, poverty, and inequality 27T
- Page 54 and 55: agriculture 29Figure 3.1Source: IHD
- Page 56 and 57: agriculture 31Figure 3.2bSource: IH
- Page 58 and 59: agriculture 33other religious minor
- Page 60 and 61: agriculture 35Figure 3.5Source: IHD
- Page 62 and 63: agriculture 37Table A.3.1aCultivati
- Page 64 and 65: 4EmploymentChapter 2 noted tremendo
- Page 66 and 67: employment 41Box 4.1Education Does
- Page 68 and 69: employment 43in urban areas, animal
- Page 70 and 71: employment 45not surprising that Ta
- Page 72 and 73: employment 47These agricultural and
- Page 74 and 75: employment 49Table A.4.1a Work Part
- Page 76 and 77: employment 51Table A.4.2a: Number o
- Page 78 and 79: employment 53Table A.4.3a: Type of
- Page 80 and 81: employment 55Table A.4.3b: Statewis
- Page 82 and 83: employment 57Table A.4.4b: Statewis
- Page 84 and 85: employment 59Table A.4.5b: Statewis
- Page 86 and 87: household assets and amenities 61WA
- Page 88 and 89: household assets and amenities 63Bo
- Page 90 and 91: household assets and amenities 65Fi
- Page 92 and 93: household assets and amenities 67an
- Page 94 and 95: household assets and amenities 69Bo
- Page 96: household assets and amenities 71Ta
- Page 100 and 101:
6EducationThe chapters on income (C
- Page 102 and 103:
education 77Figure 6.1aSource: IHDS
- Page 104 and 105:
education 7995 per cent children ag
- Page 106 and 107:
education 81Figure 6.3 Educational
- Page 108 and 109:
education 836-14 year old, about 40
- Page 110 and 111:
education 85in a lose-lose situatio
- Page 112 and 113:
education 87society. Arithmetic ski
- Page 114 and 115:
education 89Table A.6.2aDiscontinua
- Page 116 and 117:
education 91Table A.6.3a Schooling
- Page 118 and 119:
education 93Table A.6.4a Reading, W
- Page 120 and 121:
education 95Table A.6.5a Skill Leve
- Page 122 and 123:
7Health and Medical CareThroughout
- Page 124 and 125:
health and medical care 99Box 7.1Al
- Page 126 and 127:
health and medical care 101Figure 7
- Page 128 and 129:
health and medical care 103Source:
- Page 130 and 131:
health and medical care 105Figure 7
- Page 132 and 133:
health and medical care 107Medical
- Page 134 and 135:
health and medical care 109Sixty ni
- Page 136 and 137:
health and medical care 111increase
- Page 138 and 139:
health and medical care 113Figure 7
- Page 140 and 141:
health and medical care 115Box 7.3T
- Page 142 and 143:
health and medical care 117Table A.
- Page 144 and 145:
health and medical care 119Table A.
- Page 146:
health and medical care 121Table A.
- Page 150 and 151:
8Child Well-beingThe well-being of
- Page 152 and 153:
child well-being 127privileged and
- Page 154 and 155:
child well-being 129Source: IHDS 20
- Page 156 and 157:
child well-being 131age. Our result
- Page 158 and 159:
child well-being 133Table A.8.1a In
- Page 160 and 161:
child well-being 135Table A.8.2bSta
- Page 162 and 163:
child well-being 137Table A.8.3bSta
- Page 164 and 165:
well-being of the older population
- Page 166 and 167:
well-being of the older population
- Page 168 and 169:
well-being of the older population
- Page 170 and 171:
well-being of the older population
- Page 172 and 173:
well-being of the older population
- Page 174 and 175:
gender and family dynamics 149Not s
- Page 176 and 177:
gender and family dynamics 151withi
- Page 178 and 179:
gender and family dynamics 153monet
- Page 180 and 181:
gender and family dynamics 155DISCU
- Page 182 and 183:
gender and family dynamics 157Table
- Page 184 and 185:
gender and family dynamics 159Table
- Page 186 and 187:
gender and family dynamics 161Table
- Page 188 and 189:
gender and family dynamics 163Table
- Page 190 and 191:
gender and family dynamics 165Table
- Page 192:
gender and family dynamics 167Table
- Page 196 and 197:
11Social Integration and ExclusionT
- Page 198 and 199:
social integration and exclusion 17
- Page 200 and 201:
social integration and exclusion 17
- Page 202 and 203:
social integration and exclusion 17
- Page 204 and 205:
social integration and exclusion 17
- Page 206 and 207:
social integration and exclusion 18
- Page 208 and 209:
villages in a global world 183mean
- Page 210 and 211:
villages in a global world 185Table
- Page 212 and 213:
villages in a global world 187Table
- Page 214 and 215:
villages in a global world 189Table
- Page 216 and 217:
villages in a global world 191Table
- Page 218:
villages in a global world 193Figur
- Page 222 and 223:
13Social Safety Nets in IndiaPublic
- Page 224 and 225:
social safety nets in india 199Anty
- Page 226 and 227:
social safety nets in india 201THE
- Page 228 and 229:
social safety nets in india 203HIGH
- Page 230 and 231:
social safety nets in india 205(Tab
- Page 232 and 233:
14ConclusionI was again on a great
- Page 234 and 235:
conclusion 209enrolment, it also un
- Page 236 and 237:
conclusion 211availability of work
- Page 238 and 239:
Appendix I—IHDS: The DesignOne of
- Page 240 and 241:
appendix i 215Figure AI.2 India Hum
- Page 242 and 243:
appendix i 217Table AI.1Statewise D
- Page 244 and 245:
appendix i 219(Table AI.2 contd )Ne
- Page 246 and 247:
appendix i 221developed for NSS emp
- Page 248 and 249:
Appendix II—Chapter Organization
- Page 250 and 251:
appendix ii 225(Table AII.1 contd )
- Page 252 and 253:
appendix ii 227will often require t
- Page 254 and 255:
BibliographyAbbas, A.A. and G.J. Wa
- Page 256 and 257:
ibliography 231Blyn, G. (1966). Agr
- Page 258 and 259:
ibliography 233Malik, S. (1979). So