Agenda and Papers - University of Edinburgh
Agenda and Papers - University of Edinburgh
Agenda and Papers - University of Edinburgh

Create successful ePaper yourself
Turn your PDF publications into a flip-book with our unique Google optimized e-Paper software.
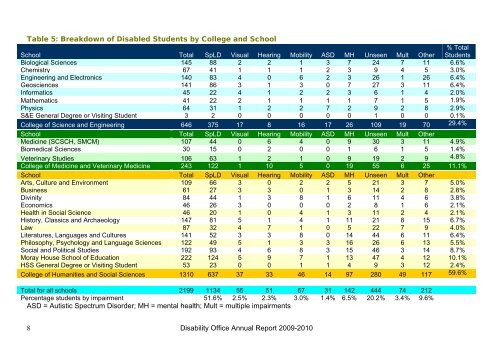
Table 5: Breakdown <strong>of</strong> Disabled Students by College <strong>and</strong> School<br />
School Total SpLD Visual Hearing Mobility ASD MH Unseen Mult Other<br />
% Total<br />
Students<br />
Biological Sciences 145 88 2 2 1 3 7 24 7 11 6.6%<br />
Chemistry 67 41 1 1 1 2 3 9 4 5 3.0%<br />
Engineering <strong>and</strong> Electronics 140 83 4 0 6 2 3 26 1 26 6.4%<br />
Geosciences 141 86 3 1 3 0 7 27 3 11 6.4%<br />
Informatics 45 22 4 1 2 2 3 6 1 4 2.0%<br />
Mathematics 41 22 2 1 1 1 1 7 1 5 1.9%<br />
Physics 64 31 1 2 2 7 2 9 2 8 2.9%<br />
S&E General Degree or Visiting Student 3 2 0 0 0 0 0 1 0 0 0.1%<br />
College <strong>of</strong> Science <strong>and</strong> Engineering 646 375 17 8 16 17 26 109 19 70 29.4%<br />
School Total SpLD Visual Hearing Mobility ASD MH Unseen Mult Other<br />
Medicine (SCSCH, SMCM) 107 44 0 6 4 0 9 30 3 11 4.9%<br />
Biomedical Sciences 30 15 0 2 0 0 1 6 1 5 1.4%<br />
Veterinary Studies 106 63 1 2 1 0 9 19 2 9 4.8%<br />
College <strong>of</strong> Medicine <strong>and</strong> Veterinary Medicine 243 122 1 10 5 0 19 55 6 25 11.1%<br />
School Total SpLD Visual Hearing Mobility ASD MH Unseen Mult Other<br />
Arts, Culture <strong>and</strong> Environment 109 66 3 0 2 2 5 21 3 7 5.0%<br />
Business 61 27 3 3 0 1 3 14 2 8 2.8%<br />
Divinity 84 44 1 3 8 1 6 11 4 6 3.8%<br />
Economics 46 26 3 0 0 0 2 8 1 6 2.1%<br />
Health in Social Science 46 20 1 0 4 1 3 11 2 4 2.1%<br />
History, Classics <strong>and</strong> Archaeology 147 81 5 1 4 1 11 21 8 15 6.7%<br />
Law 87 32 4 7 1 0 5 22 7 9 4.0%<br />
Literatures, Languages <strong>and</strong> Cultures 141 52 3 3 8 0 14 44 6 11 6.4%<br />
Philosophy, Psychology <strong>and</strong> Language Sciences 122 49 5 1 3 3 16 26 6 13 5.5%<br />
Social <strong>and</strong> Political Studies 192 93 4 6 8 3 15 46 3 14 8.7%<br />
Moray House School <strong>of</strong> Education 222 124 5 9 7 1 13 47 4 12 10.1%<br />
HSS General Degree or Visiting Student 53 23 0 0 1 1 4 9 3 12 2.4%<br />
College <strong>of</strong> Humanities <strong>and</strong> Social Sciences 1310 637 37 33 46 14 97 280 49 117 59.6%<br />
Total for all schools 2199 1134 55 51 67 31 142 444 74 212<br />
Percentage students by impairment 51.6% 2.5% 2.3% 3.0% 1.4% 6.5% 20.2% 3.4% 9.6%<br />
ASD = Autistic Spectrum Disorder; MH = mental health; Mult = multiple impairments<br />
8<br />
Disability Office Annual Report 2009-2010