CSEM Scientific and Technical Report 2008
CSEM Scientific and Technical Report 2008
CSEM Scientific and Technical Report 2008

Create successful ePaper yourself
Turn your PDF publications into a flip-book with our unique Google optimized e-Paper software.
Element Sensitive X-ray Imaging – a Roentgen Progress<br />
J. Nüesch, P. Seitz<br />
X-ray absorption spectroscopy allows detecting the elemental composition of an investigated object.<br />
For the last hundred years x-ray absorption images gave only<br />
the density of the scanned sample. There is the possibility to<br />
use the fluorescent radiation of a sample surface to determine<br />
its composition. But the volumetric information gets lost with<br />
this approach as the fluorescent radiation is emitted in 4 π <strong>and</strong><br />
it only works for the surface<br />
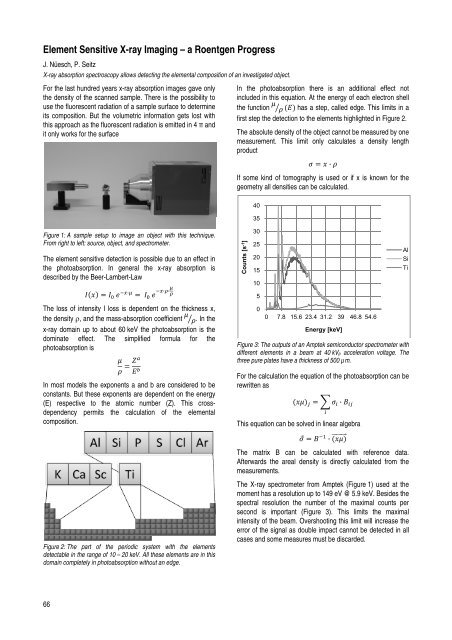
Figure 1: A sample setup to image an object with this technique.<br />
From right to left: source, object, <strong>and</strong> spectrometer.<br />
The element sensitive detection is possible due to an effect in<br />
the photoabsorption. In general the x-ray absorption is<br />
described by the Beer-Lambert-Law<br />
66<br />
���� �� � � ��·� � � � � ��·�·�<br />
�<br />
The loss of intensity I loss is dependent on the thickness x,<br />
the density ρ, <strong>and</strong> the mass-absorption coefficient � � �.<br />
In the<br />
x-ray domain up to about 60 keV the photoabsorption is the<br />
dominate effect. The simplified formula for the<br />
photoabsorption is<br />
� ��<br />
�<br />
� �� In most models the exponents a <strong>and</strong> b are considered to be<br />
constants. But these exponents are dependent on the energy<br />
(E) respective to the atomic number (Z). This crossdependency<br />
permits the calculation of the elemental<br />
composition.<br />
Figure 2: The part of the periodic system with the elements<br />
detectable in the range of 10 – 20 keV. All these elements are in this<br />
domain completely in photoabsorption without an edge.<br />
In the photoabsorption there is an additional effect not<br />
included in this equation. At the energy of each electron shell<br />
the function � �� ��� has a step, called edge. This limits in a<br />
first step the detection to the elements highlighted in Figure 2.<br />
The absolute density of the object cannot be measured by one<br />
measurement. This limit only calculates a density length<br />
product<br />
���·�<br />
If some kind of tomography is used or if x is known for the<br />
geometry all densities can be calculated.<br />
Counts [s -1 ]<br />
40<br />
35<br />
30<br />
25<br />
20<br />
15<br />
10<br />
5<br />
0<br />
0 7.8 15.6 23.4 31.2 39 46.8 54.6<br />
Energy [keV]<br />
Figure 3: The outputs of an Amptek semiconductor spectrometer with<br />
different elements in a beam at 40 kVp acceleration voltage. The<br />
three pure plates have a thickness of 500 µm.<br />
For the calculation the equation of the photoabsorption can be<br />
rewritten as<br />
���� � ��� � ·� ��<br />
This equation can be solved in linear algebra<br />
�� ���� ·���� ����������<br />
The matrix B can be calculated with reference data.<br />
Afterwards the areal density is directly calculated from the<br />
measurements.<br />
The X-ray spectrometer from Amptek (Figure 1) used at the<br />
moment has a resolution up to 149 eV @ 5.9 keV. Besides the<br />
spectral resolution the number of the maximal counts per<br />
second is important (Figure 3). This limits the maximal<br />
intensity of the beam. Overshooting this limit will increase the<br />
error of the signal as double impact cannot be detected in all<br />
cases <strong>and</strong> some measures must be discarded.<br />
�<br />
Al<br />
Si<br />
Ti