

What do students know and understand about the Holocaust?
What-do-students-know-and-understand-about-the-Holocaust1
What-do-students-know-and-understand-about-the-Holocaust1

Create successful ePaper yourself
Turn your PDF publications into a flip-book with our unique Google optimized e-Paper software.
256<br />
Appendix 6: Multiple regression analyses<br />
Appendix 6<br />
Multiple regression analyses<br />
Multiple regression analyses were used to compare<br />
attitudes towards learning <strong>about</strong> <strong>the</strong> <strong>Holocaust</strong><br />
among <strong>students</strong> from different religious groups <strong>and</strong><br />
after controlling for year group, vocabulary scores,<br />
gender <strong>and</strong> number of books in <strong>the</strong> home.<br />
Following <strong>the</strong> approach of Sullivan <strong>and</strong> Brown<br />
(2015), <strong>the</strong> dependent variables were treated as<br />
percentage scores in this analysis to make <strong>the</strong><br />
coefficients interpretable as percentage point<br />
differences.<br />
As shown in Table A6.2, <strong>the</strong> numbers of <strong>students</strong><br />
in each religious group varies considerably so <strong>the</strong>se<br />
results should be interpreted with caution due to very<br />
high st<strong>and</strong>ard errors.<br />
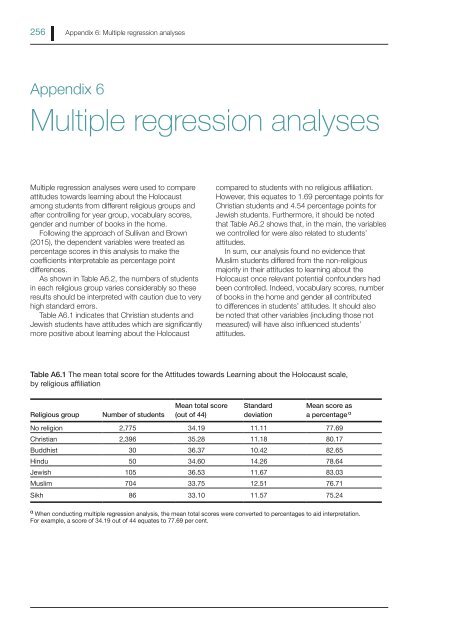
Table A6.1 indicates that Christian <strong>students</strong> <strong>and</strong><br />
Jewish <strong>students</strong> have attitudes which are significantly<br />
more positive <strong>about</strong> learning <strong>about</strong> <strong>the</strong> <strong>Holocaust</strong><br />
compared to <strong>students</strong> with no religious affiliation.<br />
However, this equates to 1.69 percentage points for<br />
Christian <strong>students</strong> <strong>and</strong> 4.54 percentage points for<br />
Jewish <strong>students</strong>. Fur<strong>the</strong>rmore, it should be noted<br />
that Table A6.2 shows that, in <strong>the</strong> main, <strong>the</strong> variables<br />
we controlled for were also related to <strong>students</strong>’<br />
attitudes.<br />
In sum, our analysis found no evidence that<br />
Muslim <strong>students</strong> differed from <strong>the</strong> non-religious<br />
majority in <strong>the</strong>ir attitudes to learning <strong>about</strong> <strong>the</strong><br />
<strong>Holocaust</strong> once relevant potential confounders had<br />
been controlled. Indeed, vocabulary scores, number<br />
of books in <strong>the</strong> home <strong>and</strong> gender all contributed<br />
to differences in <strong>students</strong>’ attitudes. It should also<br />
be noted that o<strong>the</strong>r variables (including those not<br />
measured) will have also influenced <strong>students</strong>’<br />
attitudes.<br />
Table A6.1 The mean total score for <strong>the</strong> Attitudes towards Learning <strong>about</strong> <strong>the</strong> <strong>Holocaust</strong> scale,<br />
by religious affiliation<br />
Religious group<br />
Number of <strong>students</strong><br />
Mean total score<br />
(out of 44)<br />
St<strong>and</strong>ard<br />
deviation<br />
Mean score as<br />
a percentage α<br />
No religion 2,775 34.19 11.11 77.69<br />
Christian 2,396 35.28 11.18 80.17<br />
Buddhist 30 36.37 10.42 82.65<br />
Hindu 50 34.60 14.26 78.64<br />
Jewish 105 36.53 11.67 83.03<br />
Muslim 704 33.75 12.51 76.71<br />
Sikh 86 33.10 11.57 75.24<br />
α When conducting multiple regression analysis, <strong>the</strong> mean total scores were converted to percentages to aid interpretation.<br />
For example, a score of 34.19 out of 44 equates to 77.69 per cent.