

What do students know and understand about the Holocaust?
What-do-students-know-and-understand-about-the-Holocaust1
What-do-students-know-and-understand-about-the-Holocaust1

Create successful ePaper yourself
Turn your PDF publications into a flip-book with our unique Google optimized e-Paper software.
30<br />
Metho<strong>do</strong>logy<br />
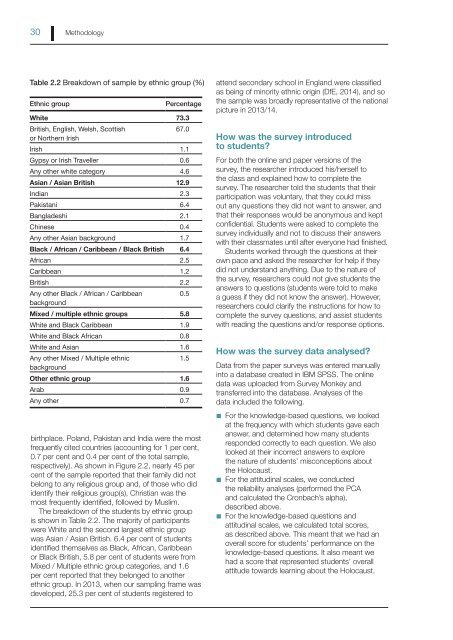
Table 2.2 Break<strong>do</strong>wn of sample by ethnic group (%)<br />
Ethnic group<br />
Percentage<br />
White 73.3<br />
British, English, Welsh, Scottish<br />
67.0<br />
or Nor<strong>the</strong>rn Irish<br />
Irish 1.1<br />
Gypsy or Irish Traveller 0.6<br />
Any o<strong>the</strong>r white category 4.6<br />
Asian / Asian British 12.9<br />
Indian 2.3<br />
Pakistani 6.4<br />
Bangladeshi 2.1<br />
Chinese 0.4<br />
Any o<strong>the</strong>r Asian background 1.7<br />
Black / African / Caribbean / Black British 6.4<br />
African 2.5<br />
Caribbean 1.2<br />
British 2.2<br />
Any o<strong>the</strong>r Black / African / Caribbean<br />
0.5<br />
background<br />
Mixed / multiple ethnic groups 5.8<br />
White <strong>and</strong> Black Caribbean 1.9<br />
White <strong>and</strong> Black African 0.8<br />
White <strong>and</strong> Asian 1.6<br />
Any o<strong>the</strong>r Mixed / Multiple ethnic<br />
1.5<br />
background<br />
O<strong>the</strong>r ethnic group 1.6<br />
Arab 0.9<br />
Any o<strong>the</strong>r 0.7<br />
birthplace. Pol<strong>and</strong>, Pakistan <strong>and</strong> India were <strong>the</strong> most<br />
frequently cited countries (accounting for 1 per cent,<br />
0.7 per cent <strong>and</strong> 0.4 per cent of <strong>the</strong> total sample,<br />
respectively). As shown in Figure 2.2, nearly 45 per<br />
cent of <strong>the</strong> sample reported that <strong>the</strong>ir family did not<br />
belong to any religious group <strong>and</strong>, of those who did<br />
identify <strong>the</strong>ir religious group(s), Christian was <strong>the</strong><br />
most frequently identified, followed by Muslim.<br />
The break<strong>do</strong>wn of <strong>the</strong> <strong>students</strong> by ethnic group<br />
is shown in Table 2.2. The majority of participants<br />
were White <strong>and</strong> <strong>the</strong> second largest ethnic group<br />
was Asian / Asian British. 6.4 per cent of <strong>students</strong><br />
identified <strong>the</strong>mselves as Black, African, Caribbean<br />
or Black British, 5.8 per cent of <strong>students</strong> were from<br />
Mixed / Multiple ethnic group categories, <strong>and</strong> 1.6<br />
per cent reported that <strong>the</strong>y belonged to ano<strong>the</strong>r<br />
ethnic group. In 2013, when our sampling frame was<br />
developed, 25.3 per cent of <strong>students</strong> registered to<br />
attend secondary school in Engl<strong>and</strong> were classified<br />
as being of minority ethnic origin (DfE, 2014), <strong>and</strong> so<br />
<strong>the</strong> sample was broadly representative of <strong>the</strong> national<br />
picture in 2013/14.<br />
How was <strong>the</strong> survey introduced<br />
to <strong>students</strong>?<br />
For both <strong>the</strong> online <strong>and</strong> paper versions of <strong>the</strong><br />
survey, <strong>the</strong> researcher introduced his/herself to<br />
<strong>the</strong> class <strong>and</strong> explained how to complete <strong>the</strong><br />
survey. The researcher told <strong>the</strong> <strong>students</strong> that <strong>the</strong>ir<br />
participation was voluntary, that <strong>the</strong>y could miss<br />
out any questions <strong>the</strong>y did not want to answer, <strong>and</strong><br />
that <strong>the</strong>ir responses would be anonymous <strong>and</strong> kept<br />
confidential. Students were asked to complete <strong>the</strong><br />
survey individually <strong>and</strong> not to discuss <strong>the</strong>ir answers<br />
with <strong>the</strong>ir classmates until after everyone had finished.<br />
Students worked through <strong>the</strong> questions at <strong>the</strong>ir<br />
own pace <strong>and</strong> asked <strong>the</strong> researcher for help if <strong>the</strong>y<br />
did not underst<strong>and</strong> anything. Due to <strong>the</strong> nature of<br />
<strong>the</strong> survey, researchers could not give <strong>students</strong> <strong>the</strong><br />
answers to questions (<strong>students</strong> were told to make<br />
a guess if <strong>the</strong>y did not <strong>know</strong> <strong>the</strong> answer). However,<br />
researchers could clarify <strong>the</strong> instructions for how to<br />
complete <strong>the</strong> survey questions, <strong>and</strong> assist <strong>students</strong><br />
with reading <strong>the</strong> questions <strong>and</strong>/or response options.<br />
How was <strong>the</strong> survey data analysed?<br />
Data from <strong>the</strong> paper surveys was entered manually<br />
into a database created in IBM SPSS. The online<br />
data was uploaded from Survey Monkey <strong>and</strong><br />
transferred into <strong>the</strong> database. Analyses of <strong>the</strong><br />
data included <strong>the</strong> following.<br />
■■<br />
For <strong>the</strong> <strong>know</strong>ledge-based questions, we looked<br />
at <strong>the</strong> frequency with which <strong>students</strong> gave each<br />
answer, <strong>and</strong> determined how many <strong>students</strong><br />
responded correctly to each question. We also<br />
looked at <strong>the</strong>ir incorrect answers to explore<br />
<strong>the</strong> nature of <strong>students</strong>’ misconceptions <strong>about</strong><br />
<strong>the</strong> <strong>Holocaust</strong>.<br />
■■<br />
For <strong>the</strong> attitudinal scales, we conducted<br />
<strong>the</strong> reliability analyses (performed <strong>the</strong> PCA<br />
<strong>and</strong> calculated <strong>the</strong> Cronbach’s alpha),<br />
described above.<br />
■■<br />
For <strong>the</strong> <strong>know</strong>ledge-based questions <strong>and</strong><br />
attitudinal scales, we calculated total scores,<br />
as described above. This meant that we had an<br />
overall score for <strong>students</strong>’ performance on <strong>the</strong><br />
<strong>know</strong>ledge-based questions. It also meant we<br />
had a score that represented <strong>students</strong>’ overall<br />
attitude towards learning <strong>about</strong> <strong>the</strong> <strong>Holocaust</strong>.