

What do students know and understand about the Holocaust?
What-do-students-know-and-understand-about-the-Holocaust1
What-do-students-know-and-understand-about-the-Holocaust1

Create successful ePaper yourself
Turn your PDF publications into a flip-book with our unique Google optimized e-Paper software.
28<br />
Metho<strong>do</strong>logy<br />
Vocabulary test<br />
We expected that <strong>students</strong>’ level of <strong>know</strong>ledge <strong>and</strong><br />
underst<strong>and</strong>ing of <strong>the</strong> <strong>Holocaust</strong> would be influenced<br />
to some extent by <strong>the</strong>ir ability level, including <strong>the</strong>ir<br />
vocabulary <strong>and</strong> comprehension skills. The survey<br />
included a series of questions to tap into this by<br />
using a subset of questions from <strong>the</strong> vocabulary<br />
test used in <strong>the</strong> 1986 Birth Cohort Study (Centre<br />
for Longitudinal Studies 2015), <strong>and</strong> informed by <strong>the</strong><br />
Age of Acquisition Databases (Centre for Reading<br />
Research 2012).<br />
Seven ‘target words’ were used, <strong>and</strong> for each<br />
target word five o<strong>the</strong>r words were presented (survey<br />
questions 17 to 23). Within <strong>the</strong>se five words was<br />
a synonym for <strong>the</strong> target word, <strong>and</strong> <strong>students</strong> were<br />
asked to identify this. For example, for <strong>the</strong> target<br />
word ‘begin’, <strong>the</strong> five synonyms presented were:<br />
‘ask’, ‘start’, ‘plain’, ‘over’ <strong>and</strong> ‘away’. Students<br />
<strong>the</strong>refore had to correctly identify that ‘start’ meant<br />
<strong>the</strong> same as ‘begin’. Students were given a total<br />
score (out of 7) for this scale, where a higher score<br />
demonstrates a larger vocabulary.<br />
How did we select schools to<br />
participate?<br />
For <strong>the</strong> survey element of <strong>the</strong> research, we<br />
developed a sampling frame using a database of<br />
schools in Engl<strong>and</strong> obtained from <strong>the</strong> Department for<br />
Education (DfE) in 2013. Schools were targeted to<br />
ensure <strong>the</strong> sample was broadly representative of:<br />
1. <strong>the</strong> number of schools in <strong>the</strong> nine government<br />
regions<br />
2. academic performance<br />
3. <strong>the</strong> composition of different ethnic groups within<br />
each region.<br />
These criteria were used because this was a national<br />
study <strong>and</strong> so it was important to include schools<br />
from across <strong>the</strong> country <strong>and</strong> ensure <strong>the</strong>y were<br />
representative of <strong>the</strong> proportion of ethnic groups in<br />
Engl<strong>and</strong>. Moreover, as <strong>the</strong> research primarily aimed<br />
to examine <strong>students</strong>’ <strong>know</strong>ledge <strong>and</strong> underst<strong>and</strong>ing,<br />
it was important to include schools with a wide range<br />
of attainment levels. Student success in gaining<br />
five pass grades at GCSE (grades A*–C, including<br />
in maths <strong>and</strong> English), was used as an indicator of<br />
schools’ academic performance.<br />
We aimed to recruit at least 5,000 <strong>students</strong> for <strong>the</strong><br />
study to reduce sampling bias <strong>and</strong> to increase <strong>the</strong><br />
power of <strong>the</strong> statistical analyses. The 2011 Census<br />
data from <strong>the</strong> Office for National Statistics was<br />
used to ascertain <strong>the</strong> break<strong>do</strong>wn of ethnic groups<br />
within <strong>the</strong> nine regions, enabling us to calculate <strong>the</strong><br />
aggregate percentage of individuals in each region<br />
who described <strong>the</strong>mselves as being: from mixed/<br />
multiple ethnic groups; Asian / Asian British; Black<br />
/ African / Caribbean / Black British; <strong>and</strong> from o<strong>the</strong>r<br />
ethnic groups – a large collective group henceforth<br />
referred to as BME (Black <strong>and</strong> minority ethnic). Using<br />
DfE data, <strong>the</strong> ethnic composition of every school<br />
was identified to determine whe<strong>the</strong>r it was above or<br />
below <strong>the</strong> BME proportion for its region.<br />
At <strong>the</strong> time of developing <strong>the</strong> sampling frame,<br />
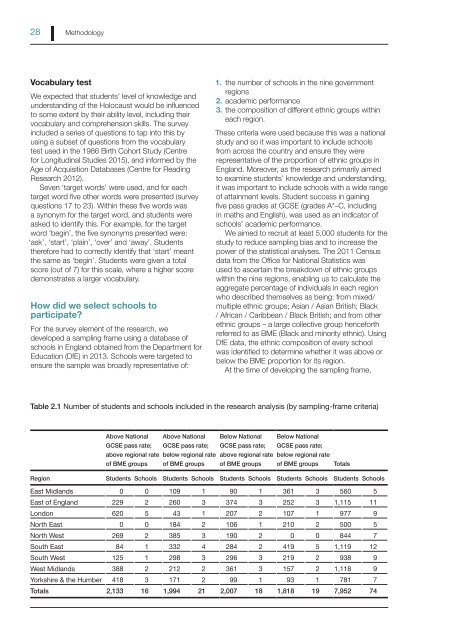
Table 2.1 Number of <strong>students</strong> <strong>and</strong> schools included in <strong>the</strong> research analysis (by sampling-frame criteria)<br />
Above National<br />
GCSE pass rate;<br />
above regional rate<br />
of BME groups<br />
Above National<br />
GCSE pass rate;<br />
below regional rate<br />
of BME groups<br />
Below National<br />
GCSE pass rate;<br />
above regional rate<br />
of BME groups<br />
Below National<br />
GCSE pass rate;<br />
below regional rate<br />
of BME groups<br />
Totals<br />
Region Students Schools Students Schools Students Schools Students Schools Students Schools<br />
East Midl<strong>and</strong>s 0 0 109 1 90 1 361 3 560 5<br />
East of Engl<strong>and</strong> 229 2 260 3 374 3 252 3 1,115 11<br />
Lon<strong>do</strong>n 620 5 43 1 207 2 107 1 977 9<br />
North East 0 0 184 2 106 1 210 2 500 5<br />
North West 269 2 385 3 190 2 0 0 844 7<br />
South East 84 1 332 4 284 2 419 5 1,119 12<br />
South West 125 1 298 3 296 3 219 2 938 9<br />
West Midl<strong>and</strong>s 388 2 212 2 361 3 157 2 1,118 9<br />
Yorkshire & <strong>the</strong> Humber 418 3 171 2 99 1 93 1 781 7<br />
Totals 2,133 16 1,994 21 2,007 18 1,818 19 7,952 74