

UNESCO SCIENCE REPORT
k0bf307feMT
k0bf307feMT

Create successful ePaper yourself
Turn your PDF publications into a flip-book with our unique Google optimized e-Paper software.
<strong>UNESCO</strong> <strong>SCIENCE</strong> <strong>REPORT</strong><br />
drain. In 1992, the government began encouraging students<br />
who had settled abroad to return home for short visits to<br />
mainland China (see Box 23.2). In 2001, the government<br />
adopted a liberalized policy inviting the diaspora to contribute<br />
to modernizing the country without any obligation to<br />
move back to China (Zweig et al., 2008). In the past decade,<br />
the government’s ambition of increasing the number of<br />
world-class universities has spawned a rash of government<br />
scholarships for study abroad: from fewer than 3 000 in 2003<br />
to over 13 000 in 2010 (British Council and DAAD, 2014).<br />
Regional schemes in Europe and Asia promoting mobility<br />
There are also regional policies promoting scientific mobility.<br />
Launched in 2000, the EU’s European Research Area<br />
exemplifies this trend. To enhance the competitiveness of<br />
European research institutions, the European Commission<br />
has launched a range of programmes to facilitate researchers’<br />
international mobility and strengthen multilateral research<br />
co-operation within the EU. For instance, the EU’s Marie<br />
Skłodowska-Curie actions programme provides researchers<br />
with grants to promote transnational, intersectorial and<br />
interdisciplinary mobility.<br />
Another initiative that is influencing cross-border mobility<br />
is EU’s requirement for publicly funded institutions to<br />
announce their vacancies internationally to provide an open<br />
labour market for researchers. Moreover, the ‘scientific visa’<br />
package expedites administrative procedures for researchers<br />
applying from non-EU countries. Around 31% of post-doctoral<br />
researchers in the EU have worked abroad for over three<br />
months at least once in the past ten years (EU, 2014).<br />
A similar initiative that is still in the early stages is the Plan<br />
of Action on Science, Technology and Innovation, 2016–2020<br />
(APASTI) adopted by the Association of Southeast Asian<br />
Nations. APASTI aims to strengthen scientific capacity in<br />
member states by fostering exchanges among researchers<br />
both within the region and beyond (see Chapter 27).<br />
More international PhD students are studying science<br />
and engineering<br />
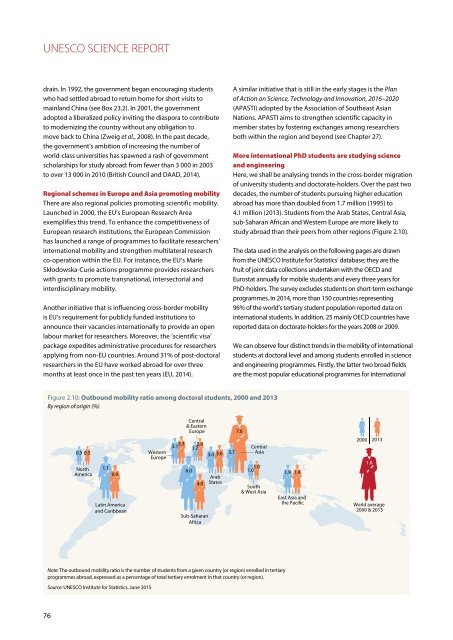
Here, we shall be analysing trends in the cross-border migration<br />
of university students and doctorate-holders. Over the past two<br />
decades, the number of students pursuing higher education<br />
abroad has more than doubled from 1.7 million (1995) to<br />
4.1 million (2013). Students from the Arab States, Central Asia,<br />
sub-Saharan African and Western Europe are more likely to<br />
study abroad than their peers from other regions (Figure 2.10).<br />
The data used in the analysis on the following pages are drawn<br />
from the <strong>UNESCO</strong> Institute for Statistics’ database; they are the<br />
fruit of joint data collections undertaken with the OECD and<br />
Eurostat annually for mobile students and every three years for<br />
PhD-holders. The survey excludes students on short-term exchange<br />
programmes. In 2014, more than 150 countries representing<br />
96% of the world’s tertiary student population reported data on<br />
international students. In addition, 25 mainly OECD countries have<br />
reported data on doctorate-holders for the years 2008 or 2009.<br />
We can observe four distinct trends in the mobility of international<br />
students at doctoral level and among students enrolled in science<br />
and engineering programmes. Firstly, the latter two broad fields<br />
are the most popular educational programmes for international<br />
Figure 2.10: Outbound mobility ratio among doctoral students, 2000 and 2013<br />
By region of origin (%)<br />
0.5 0.5<br />
North<br />
America<br />
1.1<br />
0.9<br />
Latin America<br />
and Caribbean<br />
Western<br />
Europe<br />
Figure 2.10<br />
Central<br />
& Eastern<br />
Europe<br />
3.1<br />
3.3 2.0<br />
1.7<br />
6.0<br />
4.0<br />
Sub-Saharan<br />
Africa<br />
3.4 3.6<br />
Arab<br />
States<br />
3.7<br />
7.6<br />
Central<br />
Asia<br />
1.0<br />
1.0 1.9 1.9<br />
South<br />
& West Asia<br />
East Asia and<br />
the Pacific<br />
2000<br />
1.8<br />
2013<br />
World average<br />
2000 & 2013<br />
Note: The outbound mobility ratio is the number of students from a given country (or region) enrolled in tertiary<br />
programmes abroad, expressed as a percentage of total tertiary enrolment in that country (or region).<br />
Source: <strong>UNESCO</strong> Institute for Statistics, June 2015<br />
76