UNESCO SCIENCE REPORT
k0bf307feMT
k0bf307feMT
You also want an ePaper? Increase the reach of your titles
YUMPU automatically turns print PDFs into web optimized ePapers that Google loves.
<strong>UNESCO</strong> <strong>SCIENCE</strong> <strong>REPORT</strong><br />
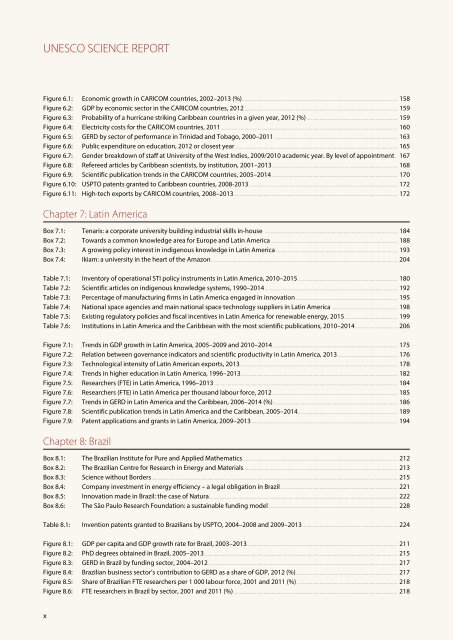
Figure 6.1: Economic growth in CARICOM countries, 2002–2013 (%).................................................................................................................................. 158<br />
Figure 6.2: GDP by economic sector in the CARICOM countries, 2012 ................................................................................................................................ 159<br />
Figure 6.3: Probability of a hurricane striking Caribbean countries in a given year, 2012 (%)............................................................................ 159<br />
Figure 6.4: Electricity costs for the CARICOM countries, 2011 .................................................................................................................................................... 160<br />
Figure 6.5: GERD by sector of performance in Trinidad and Tobago, 2000–2011 ....................................................................................................... 163<br />
Figure 6.6: Public expenditure on education, 2012 or closest year ........................................................................................................................................ 165<br />
Figure 6.7: Gender breakdown of staff at University of the West Indies, 2009/2010 academic year. By level of appointment .. 167<br />
Figure 6.8: Refereed articles by Caribbean scientists, by institution, 2001–2013 ......................................................................................................... 168<br />
Figure 6.9: Scientific publication trends in the CARICOM countries, 2005–2014 ......................................................................................................... 170<br />
Figure 6.10: USPTO patents granted to Caribbean countries, 2008-2013 ............................................................................................................................ 172<br />
Figure 6.11: High-tech exports by CARICOM countries, 2008–2013 ......................................................................................................................................... 172<br />
Chapter 7: Latin America<br />
Box 7.1: Tenaris: a corporate university building industrial skills in-house ............................................................................................................... 184<br />
Box 7.2: Towards a common knowledge area for Europe and Latin America .......................................................................................................... 188<br />
Box 7.3: A growing policy interest in indigenous knowledge in Latin America ...................................................................................................... 193<br />
Box 7.4: Ikiam: a university in the heart of the Amazon ............................................................................................................................................................ 204<br />
Table 7.1: Inventory of operational STI policy instruments in Latin America, 2010–2015 ................................................................................... 180<br />
Table 7.2: Scientific articles on indigenous knowledge systems, 1990–2014 ............................................................................................................... 192<br />
Table 7.3: Percentage of manufacturing firms in Latin America engaged in innovation ..................................................................................... 195<br />
Table 7.4: National space agencies and main national space technology suppliers in Latin America ....................................................... 198<br />
Table 7.5: Existing regulatory policies and fiscal incentives in Latin America for renewable energy, 2015 ............................................ 199<br />
Table 7.6: Institutions in Latin America and the Caribbean with the most scientific publications, 2010–2014 ................................... 206<br />
Figure 7.1: Trends in GDP growth in Latin America, 2005–2009 and 2010–2014 ........................................................................................................ 175<br />
Figure 7.2: Relation between governance indicators and scientific productivity in Latin America, 2013 .................................................. 176<br />
Figure 7.3: Technological intensity of Latin American exports, 2013 .................................................................................................................................... 178<br />
Figure 7.4: Trends in higher education in Latin America, 1996–2013 ................................................................................................................................... 182<br />
Figure 7.5: Researchers (FTE) in Latin America, 1996–2013 .......................................................................................................................................................... 184<br />
Figure 7.6: Researchers (FTE) in Latin America per thousand labour force, 2012 ......................................................................................................... 185<br />
Figure 7.7: Trends in GERD in Latin America and the Caribbean, 2006–2014 (%)........................................................................................................ 186<br />
Figure 7.8: Scientific publication trends in Latin America and the Caribbean, 2005–2014 ................................................................................... 189<br />
Figure 7.9: Patent applications and grants in Latin America, 2009–2013 .......................................................................................................................... 194<br />
Chapter 8: Brazil<br />
Box 8.1: The Brazilian Institute for Pure and Applied Mathematics.................................................................................................................................. 212<br />
Box 8.2: The Brazilian Centre for Research in Energy and Materials................................................................................................................................. 213<br />
Box 8.3: Science without Borders .............................................................................................................................................................................................................. 215<br />
Box 8.4: Company investment in energy efficiency – a legal obligation in Brazil .................................................................................................. 221<br />
Box 8.5: Innovation made in Brazil: the case of Natura.............................................................................................................................................................. 222<br />
Box 8.6: The São Paulo Research Foundation: a sustainable funding model ............................................................................................................ 228<br />
Table 8.1: Invention patents granted to Brazilians by USPTO, 2004–2008 and 2009–2013 ............................................................................... 224<br />
Figure 8.1: GDP per capita and GDP growth rate for Brazil, 2003–2013 .............................................................................................................................. 211<br />
Figure 8.2: PhD degrees obtained in Brazil, 2005–2013 .................................................................................................................................................................. 215<br />
Figure 8.3: GERD in Brazil by funding sector, 2004–2012 .............................................................................................................................................................. 217<br />
Figure 8.4: Brazilian business sector’s contribution to GERD as a share of GDP, 2012 (%)..................................................................................... 217<br />
Figure 8.5: Share of Brazilian FTE researchers per 1 000 labour force, 2001 and 2011 (%) .................................................................................... 218<br />
Figure 8.6: FTE researchers in Brazil by sector, 2001 and 2011 (%) ......................................................................................................................................... 218<br />
x


