

UNESCO SCIENCE REPORT
k0bf307feMT
k0bf307feMT

Create successful ePaper yourself
Turn your PDF publications into a flip-book with our unique Google optimized e-Paper software.
12 . Countries in the Black Sea basin<br />
Armenia, Azerbaijan, Belarus, Georgia, Moldova, Turkey, Ukraine<br />
Deniz Eröcal and Igor Yegorov<br />
Countries in the Black Sea basin<br />
INTRODUCTION<br />
Turkey is making progress, others have lost ground<br />
For want of a better term, the seven countries covered in<br />
the present chapter shall be referred to collectively as the<br />
‘Black Sea countries.’ They do not constitute a world region<br />
in the traditional sense 1 but they do present some structural<br />
similarities. For one thing, they share geographical proximity,<br />
with all but Armenia and Azerbaijan being situated in the<br />
Black Sea basin. In addition, all seven are middle-income<br />
economies seeking to move into a higher income bracket.<br />
Their differences are equally instructive. If we take trade<br />
in manufactured goods, for instance, we can discern<br />
three groups: countries with traditionally close economic<br />
integration with the Russian Federation (Armenia, Belarus,<br />
Moldova and Ukraine), some of which are now diversifying<br />
their trading partners (Moldova and Ukraine); countries<br />
which are increasingly integrated in global markets (Georgia<br />
and Turkey) and countries with a weak focus on trade in<br />
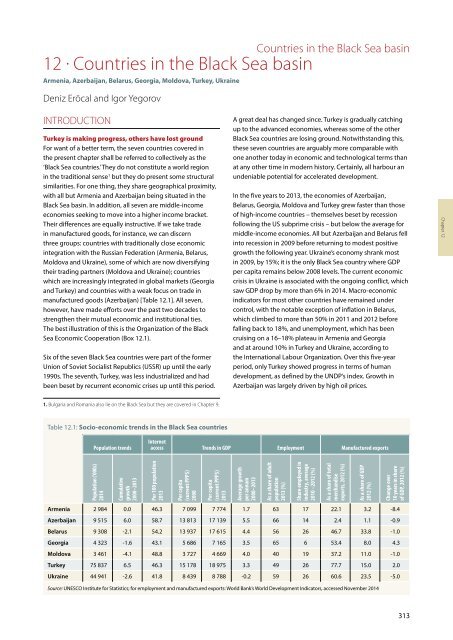
manufactured goods (Azerbaijan) [Table 12.1]. All seven,<br />
however, have made efforts over the past two decades to<br />
strengthen their mutual economic and institutional ties.<br />
The best illustration of this is the Organization of the Black<br />
Sea Economic Cooperation (Box 12.1).<br />
Six of the seven Black Sea countries were part of the former<br />
Union of Soviet Socialist Republics (USSR) up until the early<br />
1990s. The seventh, Turkey, was less industrialized and had<br />
been beset by recurrent economic crises up until this period.<br />
A great deal has changed since. Turkey is gradually catching<br />
up to the advanced economies, whereas some of the other<br />
Black Sea countries are losing ground. Notwithstanding this,<br />
these seven countries are arguably more comparable with<br />
one another today in economic and technological terms than<br />
at any other time in modern history. Certainly, all harbour an<br />
undeniable potential for accelerated development.<br />
In the five years to 2013, the economies of Azerbaijan,<br />
Belarus, Georgia, Moldova and Turkey grew faster than those<br />
of high-income countries – themselves beset by recession<br />
following the US subprime crisis – but below the average for<br />
middle-income economies. All but Azerbaijan and Belarus fell<br />
into recession in 2009 before returning to modest positive<br />
growth the following year. Ukraine’s economy shrank most<br />
in 2009, by 15%; it is the only Black Sea country where GDP<br />
per capita remains below 2008 levels. The current economic<br />
crisis in Ukraine is associated with the ongoing conflict, which<br />
saw GDP drop by more than 6% in 2014. Macro-economic<br />
indicators for most other countries have remained under<br />
control, with the notable exception of inflation in Belarus,<br />
which climbed to more than 50% in 2011 and 2012 before<br />
falling back to 18%, and unemployment, which has been<br />
cruising on a 16–18% plateau in Armenia and Georgia<br />
and at around 10% in Turkey and Ukraine, according to<br />
the International Labour Organization. Over this five-year<br />
period, only Turkey showed progress in terms of human<br />
development, as defined by the UNDP’s index. Growth in<br />
Azerbaijan was largely driven by high oil prices.<br />
Chapter 12<br />
1. Bulgaria and Romania also lie on the Black Sea but they are covered in Chapter 9.<br />
Table 12.1: Socio-economic trends in the Black Sea countries<br />
Population trends<br />
Internet<br />
access Trends in GDP Employment Manufactured exports<br />
Population (‘000s)<br />
2014<br />
Cumulative<br />
growth<br />
2008–2013<br />
Per 100 population<br />
2013<br />
Per capita<br />
(current PPP$)<br />
2008<br />
Per capita<br />
(current PPP$)<br />
2013<br />
Average growth<br />
per annum<br />
2008–2013<br />
As a share of adult<br />
population<br />
2013 (%)<br />
Share employed in<br />
industry, average<br />
2010 –2012 (%)<br />
As a share of total<br />
merchandise<br />
exports, 2012 (%)<br />
As a share of GDP<br />
2012 (%)<br />
Change over<br />
10 years in share<br />
of GDP, 2012 (%)<br />
Armenia 2 984 0.0 46.3 7 099 7 774 1.7 63 17 22.1 3.2 -8.4<br />
Azerbaijan 9 515 6.0 58.7 13 813 17 139 5.5 66 14 2.4 1.1 -0.9<br />
Belarus 9 308 -2.1 54.2 13 937 17 615 4.4 56 26 46.7 33.8 -1.0<br />
Georgia 4 323 -1.6 43.1 5 686 7 165 3.5 65 6 53.4 8.0 4.3<br />
Moldova 3 461 -4.1 48.8 3 727 4 669 4.0 40 19 37.2 11.0 -1.0<br />
Turkey 75 837 6.5 46.3 15 178 18 975 3.3 49 26 77.7 15.0 2.0<br />
Ukraine 44 941 -2.6 41.8 8 439 8 788 -0.2 59 26 60.6 23.5 -5.0<br />
Source: <strong>UNESCO</strong> Institute for Statistics; for employment and manufactured exports: World Bank’s World Development Indicators, accessed November 2014<br />
313