

UNESCO SCIENCE REPORT
k0bf307feMT
k0bf307feMT

You also want an ePaper? Increase the reach of your titles
YUMPU automatically turns print PDFs into web optimized ePapers that Google loves.
United States of America<br />
In 2012, business R&D activity was mainly concentrated in<br />
the States of California (28.1%), Illinois (4.8%), Massachusetts<br />
(5.7%), New Jersey (5.6%), Washington State (5.5%), Michigan<br />
(5.4%), Texas (5.2%), New York (3.6%) and Pennsylvania<br />
(3.5%). Science and engineering (S&E) employment is<br />
concentrated in 20 major metropolitan areas, comprising<br />
18% of all S&E employment. The metropolitan areas with<br />
the greatest share of jobs in science and engineering in<br />
2012 were all situated in the northeast, in Washington DC,<br />
Virginia, Maryland and West Virginia. Second was the Boston<br />
metropolitan area in the State of Massachusetts and third was<br />
the Seattle metropolitan area in Washington State.<br />
Retiring baby boomers may leave jobs unfilled<br />
Concern about the retirement of the ‘baby boomers 7 ’ leaving<br />
R&D jobs unfilled is a major worry of company executives.<br />
The federal government will, thus, need to provide adequate<br />
funding to train the next generation of employees with skills<br />
in science, technology, engineering and mathematics.<br />
apprenticeship programmes in strategic areas, such as<br />
advanced manufacturing, information technology,<br />
business services and health care.<br />
Signs of inertia rather than a return to growth<br />
The recession has been bad for US business research<br />
spending. From 2003 to 2008, this type of expenditure had<br />
followed a generally upward trajectory. In 2009, the curve<br />
inverted, as expenditure fell by 4% over the previous year<br />
then again in 2010, albeit by 1–2% this time. Companies in<br />
high-opportunity industries like health care cut back less<br />
than those in more mature industries, such as fossil fuels.<br />
The largest cutbacks in R&D spending were in agriculture<br />
production: -3.5% compared to the average R&D to net<br />
sales ratio. The chemicals and allied products industry and<br />
electronic equipment industry, on the other hand, showed<br />
R&D to net sales ratios that were 3.8% and 4.8% higher than<br />
average. Although the amount of R&D spending increased in<br />
2011, it was still below the level of 2008 expenditure.<br />
Many of the initiatives announced by the president focus<br />
on public–private partnerships like the American<br />
Apprenticeship Grants competition. This scheme was<br />
announced in December 2014 and is being implemented<br />
by the Department of Labor with an investment of<br />
US$ 100 million. The competition encourages public–private<br />
partnerships between employers, business associations,<br />
labour organizations, community colleges, local and<br />
state governments and NGOs to develop high-quality<br />
7. Those born between 1946 and 1964 in the aftermath of the Second World War,<br />
when there was a surge in the birth rate.<br />
By 2012, the growth rate of business-funded R&D had recovered.<br />
Whether this continues will be contingent on the pursuit of<br />
economic recovery and growth, levels of federal research<br />
funding and the general business climate. Battelle’s 2014 Global<br />
R&D Funding Forecast (published in 2013) had predicted a 4.0%<br />
increase in R&D funded by business in the USA from 2013 to<br />
2014 to US$ 307.5 billion – about one-fifth of global R&D.<br />
The industry information provider, IBIS World, shows business<br />
R&D expenditure increasing in 2015, decreasing in 2017–2018<br />
then rising again, but only slightly, in 2019 (Edwards, 2015).<br />
IBIS attributes this to the transition from dependence on<br />
Chapter 5<br />
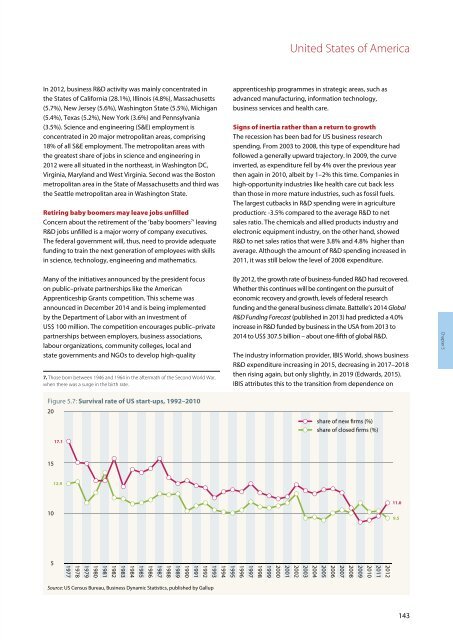
Figure 5.7: Survival rate of US start-ups, 1992–2010<br />
20<br />
17.1<br />
share of new firms (%)<br />
share of closed firms (%)<br />
15<br />
12.9<br />
10<br />
11.0<br />
9.5<br />
5<br />
1977<br />
1978<br />
1979<br />
1980<br />
1981<br />
1982<br />
1983<br />
1984<br />
1985<br />
1986<br />
1987<br />
1988<br />
1989<br />
1990<br />
1991<br />
1992<br />
1993<br />
1994<br />
1995<br />
1996<br />
1997<br />
1998<br />
1999<br />
2000<br />
2001<br />
2002<br />
2003<br />
2004<br />
2005<br />
2006<br />
2007<br />
2008<br />
2009<br />
2010<br />
2011<br />
2012<br />
Source: US Census Bureau, Business Dynamic Statistics, published by Gallup<br />
143