- Page 1 and 2:
Proceedings of the 63rd ANNUAL EAST
- Page 3 and 4:
FOREWORD T his proceedings volume c
- Page 5 and 6:
CONTENTS Foreword..................
- Page 7 and 8:
STATEMENT OF PURPOSE The Eastern Sn
- Page 9 and 10:
EXECUTIVES FOR THE 63rd EASTERN SNO
- Page 11 and 12:
THE PRESIDENT’S PAGE The 63rd ann
- Page 13 and 14:
Weisnet Medal for Best Student Pape
- Page 15 and 16:
3 63 rd EASTERN SNOW CONFERENCE New
- Page 17 and 18:
Figure 1. Layer 1 represents the so
- Page 19 and 20:
Figure 4. The general layout of the
- Page 21 and 22:
lue color represented no convection
- Page 23 and 24:
Total Density of Water Profiles The
- Page 25 and 26:
Figure 11(a). Simulated snow grain
- Page 27 and 28:
Jordan R, 1991. A one-dimensional t
- Page 29 and 30:
Campbell Scientific Award for Best
- Page 31 and 32:
19 63 rd EASTERN SNOW CONFERENCE Ne
- Page 33 and 34:
21 63 rd EASTERN SNOW CONFERENCE Ne
- Page 35 and 36:
23 63 rd EASTERN SNOW CONFERENCE Ne
- Page 37 and 38:
25 63 rd EASTERN SNOW CONFERENCE Ne
- Page 39 and 40:
27 63 rd EASTERN SNOW CONFERENCE Ne
- Page 41 and 42:
R ∑i ∑ n 2 = 1 NS = − n i = 1
- Page 43 and 44:
31 63 rd EASTERN SNOW CONFERENCE Ne
- Page 45 and 46:
33 63 rd EASTERN SNOW CONFERENCE Ne
- Page 47 and 48:
35 63 rd EASTERN SNOW CONFERENCE Ne
- Page 49 and 50:
Snow and Climate 37
- Page 51 and 52:
39 63 rd EASTERN SNOW CONFERENCE Ne
- Page 53 and 54:
Spatial distributions of changes in
- Page 55 and 56:
Snow and Climate Posters 43
- Page 57 and 58:
45 63 rd EASTERN SNOW CONFERENCE Ne
- Page 59 and 60:
Figure 2 presents correlation maps
- Page 61 and 62: CONCLUSIONS Three regional-continen
- Page 63 and 64: 51 63 rd EASTERN SNOW CONFERENCE Ne
- Page 65 and 66: Discharge (mm) 20 18 16 14 12 10 8
- Page 67 and 68: ABSTRACT 55 63 rd EASTERN SNOW CONF
- Page 69 and 70: This paper analyzes the synoptic pa
- Page 71 and 72: Cyclones that track west of the App
- Page 73 and 74: The synoptic-scale atmospheric circ
- Page 75 and 76: CONCLUSIONS The record snowfall in
- Page 77 and 78: 65 63 rd EASTERN SNOW CONFERENCE Ne
- Page 79 and 80: correlations between April-May snow
- Page 81 and 82: Figure 3. Linear correlations betwe
- Page 83 and 84: winter/early spring could contribut
- Page 85 and 86: Snow Remote Sensing 73
- Page 87 and 88: 75 63 rd EASTERN SNOW CONFERENCE Ne
- Page 89 and 90: height averaged 11.4 m with an aver
- Page 91 and 92: strings were buried 20 - 30 cm belo
- Page 93 and 94: Although the λE/Rn fraction was on
- Page 95 and 96: estimated snow depth based on the 2
- Page 97 and 98: important to note that the average
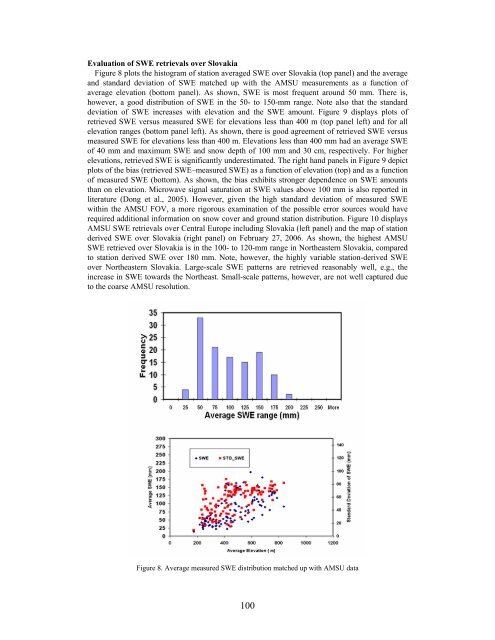
- Page 99 and 100: Schmidt, R. A., C. A. Troendle, and
- Page 101 and 102: 89 63 rd EASTERN SNOW CONFERENCE Ne
- Page 103 and 104: METHODS The IMS Product The IMS was
- Page 105 and 106: Figure 1. Microwave spectral charac
- Page 107 and 108: snow depth and SWE on a weekly basi
- Page 109 and 110: Figure 4. Example of blended SWE pr
- Page 111: Evaluation of the global distributi
- Page 115 and 116: Helfrich, S.R., D. McNamara, B.H.Ra
- Page 117 and 118: 105 63 rd EASTERN SNOW CONFERENCE N
- Page 119 and 120: and validated regionally so they ca
- Page 121 and 122: 109 Test Site Figure 2. Variation o
- Page 123 and 124: Correlation Coe. Correlation Coe. C
- Page 125 and 126: Figure 8. SSM/I scattering signatur
- Page 127 and 128: Considering the facts mentioned abo
- Page 129 and 130: Besides the temporal validation, th
- Page 131 and 132: RMSE Non linear Azar Chang Goodison
- Page 133 and 134: 63 nd EASTERN SNOW CONFERENCE Newar
- Page 135 and 136: http://www.ccin.ca); from simulatio
- Page 137 and 138: over the period 1988-2000. With the
- Page 139 and 140: Figure 3: Explained variance (R 2 )
- Page 141 and 142: correspondence between simulated an
- Page 143 and 144: values. Continued development of ne
- Page 145 and 146: National Climatic Data Center (2005
- Page 147 and 148: Snow Remote Sensing Posters 135
- Page 149 and 150: ABSTRACT 63 rd EASTERN SNOW CONFERE
- Page 151 and 152: day and has a mean pixel resolution
- Page 153 and 154: Table 1. Wheaton River basin EASE-G
- Page 155 and 156: The SSM/I snowmelt onset algorithm
- Page 157 and 158: coarse-resolution pixel with the hi
- Page 159 and 160: Figure 5. (a) Scatterplot of snowpa
- Page 161 and 162: For both 2004 and 2005, the AMSR-E
- Page 163 and 164:
threshold of ±18 K that reflects t
- Page 165 and 166:
ABSTRACT 153 63 rd EASTERN SNOW CON
- Page 167 and 168:
DATA USED SSM/I & QuikSCAT Coverage
- Page 169 and 170:
157 63 rd EASTERN SNOW CONFERENCE N
- Page 171 and 172:
159 63 rd EASTERN SNOW CONFERENCE N
- Page 173 and 174:
161 63 rd EASTERN SNOW CONFERENCE N
- Page 175 and 176:
180 160 140 120 100 80 60 40 20 0 1
- Page 177 and 178:
165 63 rd EASTERN SNOW CONFERENCE N
- Page 179 and 180:
independent of regions. This greatl
- Page 181 and 182:
slightly vary the IMS with this pro
- Page 183 and 184:
imagery, the higher latitudes rely
- Page 185 and 186:
MODIS Land Science Team, NASA Godda
- Page 187 and 188:
FUTURE OF IMS Enhancements to the I
- Page 189 and 190:
information never present before on
- Page 191 and 192:
Brubaker, K.L., R. Pinker and E. De
- Page 193 and 194:
181 63 rd EASTERN SNOW CONFERENCE N
- Page 195 and 196:
The Sierra Nevada del Cocuy region
- Page 197 and 198:
Colombia Venezuela Glacier Series R
- Page 199 and 200:
Table 4. Glacier Areas of the Ruiz-
- Page 201 and 202:
Pico Bonpland Massif-Sinigüis Glac
- Page 203 and 204:
Linder W, Jordan E, 1991. Ice-mass
- Page 205 and 206:
Snowpack Processes 193
- Page 207 and 208:
63 rd EASTERN SNOW CONFERENCE Newar
- Page 209 and 210:
In the following paragraph the main
- Page 211 and 212:
Figure 1: Variation of the season a
- Page 213 and 214:
Figure 3: 8-day composite maps (24
- Page 215 and 216:
The third pair (Figure 5) represent
- Page 217 and 218:
Figure 9: Time evolution of SWE ave
- Page 219 and 220:
melting occurs, whereas at the high
- Page 221 and 222:
Colbeck SC, Anderson EA. 1982. The
- Page 223 and 224:
ABSTRACT 211 63 rd EASTERN SNOW CON
- Page 225 and 226:
A B Figure 1. Low-magnification sec
- Page 227 and 228:
GB ridge GB groove Figure 3. Higher
- Page 229 and 230:
CONCLUSION Figure 5. Indexed electr
- Page 231 and 232:
219 63rd EASTERN SNOW CONFERENCE De
- Page 233 and 234:
Meteorological data for the winter
- Page 235 and 236:
monthly probability adjusted data 4
- Page 237 and 238:
225 Pullman WA Rawlins WY Leadville
- Page 239 and 240:
The daily wind speed can exceed 6.5
- Page 241 and 242:
NCDC. 2006. National Climate Data C
- Page 243 and 244:
ABSTRACT 231 63 rd EASTERN SNOW CON
- Page 245 and 246:
and mass balances for 540 environme
- Page 247 and 248:
Temperature, precipitation, windspe
- Page 249 and 250:
the left in response to snow compac
- Page 251 and 252:
Pinched-cone dimensions for each sl
- Page 253 and 254:
Terrain slope (degrees) Terrain slo
- Page 255 and 256:
ACKNOWLEDGEMENTS This work was fund
- Page 257 and 258:
Glacial and Periglacial Processes 2
- Page 259 and 260:
247 63 rd EASTERN SNOW CONFERENCE N
- Page 261 and 262:
From linear regression the constant
- Page 263 and 264:
251 63 rd EASTERN SNOW CONFERENCE N
- Page 265 and 266:
DATA COLLECTION Figure 1. Location
- Page 267 and 268:
Table 1. Comparison of GPS measured
- Page 269 and 270:
Transverse Velocity Profiles Surfac
- Page 271 and 272:
is shown in Figure 4. This variatio
- Page 273 and 274:
Table 4. The calculated volume flux
- Page 275 and 276:
263 63 rd EASTERN SNOW CONFERENCE N
- Page 277 and 278:
Figure 1. Cordillera Blanca regiona
- Page 279 and 280:
MATERIALS AND METHODS Field Measure
- Page 281 and 282:
Data analysis techniques We synthes
- Page 283 and 284:
season, but unacceptable for the dr
- Page 285 and 286:
significant, although more informat
- Page 287 and 288:
(a) Liquid Water (mm) Dry Period: M
- Page 289 and 290:
Future Work We are installing addit
- Page 291 and 292:
Shuttleworth, W.J., and J.S. Wallac
- Page 293 and 294:
Snow and Periglacial Processes Post
- Page 295 and 296:
283 63 rd EASTERN SNOW CONFERENCE N
- Page 297 and 298:
----- -------------- ------- ------
- Page 299 and 300:
No one to date has shown why snowfl
- Page 301 and 302:
APPENDIX A Northern Hemisphere Year
- Page 303 and 304:
62nd ESC Papers 291
- Page 305 and 306:
62 nd EASTERN SNOW CONFERENCE Water
- Page 307 and 308:
each other; and, they both decrease
- Page 309 and 310:
297 62 nd EASTERN SNOW CONFERENCE W
- Page 311 and 312:
comes in the form of precipitation.
- Page 313 and 314:
averaged to reduce bias in this var
- Page 315 and 316:
RESULTS Figure 2. Flow chart of reg
- Page 317 and 318:
Table 6: Actual-Conditions SWE, dep
- Page 319 and 320:
307 Table 9: Regression results bet
- Page 321 and 322:
Goita, K., A. Walker, B. Goodison,
- Page 323:
TO ERR IS HUMAN, TO FORGET IT WOULD