

Download the entire proceedings as an Adobe PDF - Eastern Snow ...
Download the entire proceedings as an Adobe PDF - Eastern Snow ...
Download the entire proceedings as an Adobe PDF - Eastern Snow ...

You also want an ePaper? Increase the reach of your titles
YUMPU automatically turns print PDFs into web optimized ePapers that Google loves.
24<br />
63 rd EASTERN SNOW CONFERENCE<br />
Newark, Delaware USA 2006<br />
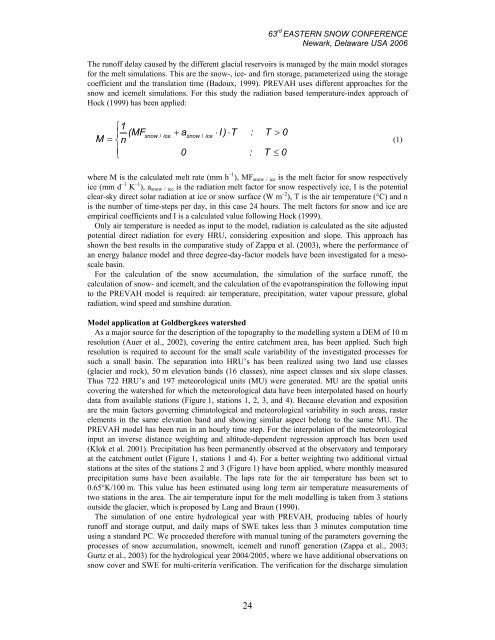
The runoff delay caused by <strong>the</strong> different glacial reservoirs is m<strong>an</strong>aged by <strong>the</strong> main model storages<br />
for <strong>the</strong> melt simulations. This are <strong>the</strong> snow-, ice- <strong>an</strong>d firn storage, parameterized using <strong>the</strong> storage<br />
coefficient <strong>an</strong>d <strong>the</strong> tr<strong>an</strong>slation time (Badoux, 1999). PREVAH uses different approaches for <strong>the</strong><br />
snow <strong>an</strong>d icemelt simulations. For this study <strong>the</strong> radiation b<strong>as</strong>ed temperature-index approach of<br />
Hock (1999) h<strong>as</strong> been applied:<br />
⎧1<br />
⎪ (MF<br />
M = ⎨n<br />
⎪<br />
⎩<br />
snow / ice<br />
+ a<br />
0<br />
snow / ice<br />
⋅I<br />
) ⋅T<br />
:<br />
:<br />
T > 0<br />
T ≤ 0<br />
where M is <strong>the</strong> calculated melt rate (mm h –1 ), MFsnow / ice is <strong>the</strong> melt factor for snow respectively<br />
ice (mm d –1 K –1 ), <strong>as</strong>now / ice is <strong>the</strong> radiation melt factor for snow respectively ice, I is <strong>the</strong> potential<br />
clear-sky direct solar radiation at ice or snow surface (W m –2 ), T is <strong>the</strong> air temperature (°C) <strong>an</strong>d n<br />
is <strong>the</strong> number of time-steps per day, in this c<strong>as</strong>e 24 hours. The melt factors for snow <strong>an</strong>d ice are<br />
empirical coefficients <strong>an</strong>d I is a calculated value following Hock (1999).<br />
Only air temperature is needed <strong>as</strong> input to <strong>the</strong> model, radiation is calculated <strong>as</strong> <strong>the</strong> site adjusted<br />
potential direct radiation for every HRU, considering exposition <strong>an</strong>d slope. This approach h<strong>as</strong><br />
shown <strong>the</strong> best results in <strong>the</strong> comparative study of Zappa et al. (2003), where <strong>the</strong> perform<strong>an</strong>ce of<br />
<strong>an</strong> energy bal<strong>an</strong>ce model <strong>an</strong>d three degree-day-factor models have been investigated for a mesoscale<br />
b<strong>as</strong>in.<br />
For <strong>the</strong> calculation of <strong>the</strong> snow accumulation, <strong>the</strong> simulation of <strong>the</strong> surface runoff, <strong>the</strong><br />
calculation of snow- <strong>an</strong>d icemelt, <strong>an</strong>d <strong>the</strong> calculation of <strong>the</strong> evapotr<strong>an</strong>spiration <strong>the</strong> following input<br />
to <strong>the</strong> PREVAH model is required: air temperature, precipitation, water vapour pressure, global<br />
radiation, wind speed <strong>an</strong>d sunshine duration.<br />
Model application at Goldbergkees watershed<br />
As a major source for <strong>the</strong> description of <strong>the</strong> topography to <strong>the</strong> modelling system a DEM of 10 m<br />
resolution (Auer et al., 2002), covering <strong>the</strong> <strong>entire</strong> catchment area, h<strong>as</strong> been applied. Such high<br />
resolution is required to account for <strong>the</strong> small scale variability of <strong>the</strong> investigated processes for<br />
such a small b<strong>as</strong>in. The separation into HRU’s h<strong>as</strong> been realized using two l<strong>an</strong>d use cl<strong>as</strong>ses<br />
(glacier <strong>an</strong>d rock), 50 m elevation b<strong>an</strong>ds (16 cl<strong>as</strong>ses), nine <strong>as</strong>pect cl<strong>as</strong>ses <strong>an</strong>d six slope cl<strong>as</strong>ses.<br />
Thus 722 HRU’s <strong>an</strong>d 197 meteorological units (MU) were generated. MU are <strong>the</strong> spatial units<br />
covering <strong>the</strong> watershed for which <strong>the</strong> meteorological data have been interpolated b<strong>as</strong>ed on hourly<br />
data from available stations (Figure 1, stations 1, 2, 3, <strong>an</strong>d 4). Because elevation <strong>an</strong>d exposition<br />
are <strong>the</strong> main factors governing climatological <strong>an</strong>d meteorological variability in such are<strong>as</strong>, r<strong>as</strong>ter<br />
elements in <strong>the</strong> same elevation b<strong>an</strong>d <strong>an</strong>d showing similar <strong>as</strong>pect belong to <strong>the</strong> same MU. The<br />
PREVAH model h<strong>as</strong> been run in <strong>an</strong> hourly time step. For <strong>the</strong> interpolation of <strong>the</strong> meteorological<br />
input <strong>an</strong> inverse dist<strong>an</strong>ce weighting <strong>an</strong>d altitude-dependent regression approach h<strong>as</strong> been used<br />
(Klok et al. 2001). Precipitation h<strong>as</strong> been perm<strong>an</strong>ently observed at <strong>the</strong> observatory <strong>an</strong>d temporary<br />
at <strong>the</strong> catchment outlet (Figure 1, stations 1 <strong>an</strong>d 4). For a better weighting two additional virtual<br />
stations at <strong>the</strong> sites of <strong>the</strong> stations 2 <strong>an</strong>d 3 (Figure 1) have been applied, where monthly me<strong>as</strong>ured<br />
precipitation sums have been available. The laps rate for <strong>the</strong> air temperature h<strong>as</strong> been set to<br />
0.65°K/100 m. This value h<strong>as</strong> been estimated using long term air temperature me<strong>as</strong>urements of<br />
two stations in <strong>the</strong> area. The air temperature input for <strong>the</strong> melt modelling is taken from 3 stations<br />
outside <strong>the</strong> glacier, which is proposed by L<strong>an</strong>g <strong>an</strong>d Braun (1990).<br />
The simulation of one <strong>entire</strong> hydrological year with PREVAH, producing tables of hourly<br />
runoff <strong>an</strong>d storage output, <strong>an</strong>d daily maps of SWE takes less th<strong>an</strong> 3 minutes computation time<br />
using a st<strong>an</strong>dard PC. We proceeded <strong>the</strong>refore with m<strong>an</strong>ual tuning of <strong>the</strong> parameters governing <strong>the</strong><br />
processes of snow accumulation, snowmelt, icemelt <strong>an</strong>d runoff generation (Zappa et al., 2003;<br />
Gurtz et al., 2003) for <strong>the</strong> hydrological year 2004/2005, where we have additional observations on<br />
snow cover <strong>an</strong>d SWE for multi-criteria verification. The verification for <strong>the</strong> discharge simulation<br />
(1)


