

Download the entire proceedings as an Adobe PDF - Eastern Snow ...
Download the entire proceedings as an Adobe PDF - Eastern Snow ...
Download the entire proceedings as an Adobe PDF - Eastern Snow ...

You also want an ePaper? Increase the reach of your titles
YUMPU automatically turns print PDFs into web optimized ePapers that Google loves.
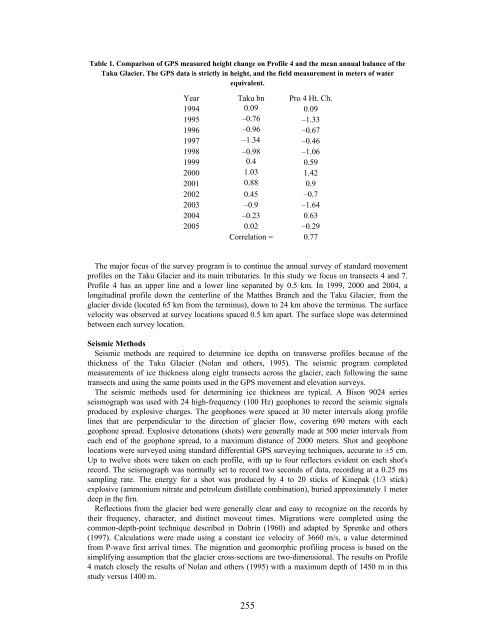
Table 1. Comparison of GPS me<strong>as</strong>ured height ch<strong>an</strong>ge on Profile 4 <strong>an</strong>d <strong>the</strong> me<strong>an</strong> <strong>an</strong>nual bal<strong>an</strong>ce of <strong>the</strong><br />
Taku Glacier. The GPS data is strictly in height, <strong>an</strong>d <strong>the</strong> field me<strong>as</strong>urement in meters of water<br />
equivalent.<br />
Year Taku bn Pro 4 Ht. Ch.<br />
1994 0.09 0.09<br />
1995 –0.76 –1.33<br />
1996 –0.96 –0.67<br />
1997 –1.34 –0.46<br />
1998 –0.98 –1.06<br />
1999 0.4 0.59<br />
2000 1.03 1.42<br />
2001 0.88 0.9<br />
2002 0.45 –0.7<br />
2003 –0.9 –1.64<br />
2004 –0.23 0.63<br />
2005 0.02 –0.29<br />
Correlation = 0.77<br />
The major focus of <strong>the</strong> survey program is to continue <strong>the</strong> <strong>an</strong>nual survey of st<strong>an</strong>dard movement<br />
profiles on <strong>the</strong> Taku Glacier <strong>an</strong>d its main tributaries. In this study we focus on tr<strong>an</strong>sects 4 <strong>an</strong>d 7.<br />
Profile 4 h<strong>as</strong> <strong>an</strong> upper line <strong>an</strong>d a lower line separated by 0.5 km. In 1999, 2000 <strong>an</strong>d 2004, a<br />
longitudinal profile down <strong>the</strong> centerline of <strong>the</strong> Mat<strong>the</strong>s Br<strong>an</strong>ch <strong>an</strong>d <strong>the</strong> Taku Glacier, from <strong>the</strong><br />
glacier divide (located 65 km from <strong>the</strong> terminus), down to 24 km above <strong>the</strong> terminus. The surface<br />
velocity w<strong>as</strong> observed at survey locations spaced 0.5 km apart. The surface slope w<strong>as</strong> determined<br />
between each survey location.<br />
Seismic Methods<br />
Seismic methods are required to determine ice depths on tr<strong>an</strong>sverse profiles because of <strong>the</strong><br />
thickness of <strong>the</strong> Taku Glacier (Nol<strong>an</strong> <strong>an</strong>d o<strong>the</strong>rs, 1995). The seismic program completed<br />
me<strong>as</strong>urements of ice thickness along eight tr<strong>an</strong>sects across <strong>the</strong> glacier, each following <strong>the</strong> same<br />
tr<strong>an</strong>sects <strong>an</strong>d using <strong>the</strong> same points used in <strong>the</strong> GPS movement <strong>an</strong>d elevation surveys.<br />
The seismic methods used for determining ice thickness are typical. A Bison 9024 series<br />
seismograph w<strong>as</strong> used with 24 high-frequency (100 Hz) geophones to record <strong>the</strong> seismic signals<br />
produced by explosive charges. The geophones were spaced at 30 meter intervals along profile<br />
lines that are perpendicular to <strong>the</strong> direction of glacier flow, covering 690 meters with each<br />
geophone spread. Explosive detonations (shots) were generally made at 500 meter intervals from<br />
each end of <strong>the</strong> geophone spread, to a maximum dist<strong>an</strong>ce of 2000 meters. Shot <strong>an</strong>d geophone<br />
locations were surveyed using st<strong>an</strong>dard differential GPS surveying techniques, accurate to ±5 cm.<br />
Up to twelve shots were taken on each profile, with up to four reflectors evident on each shot's<br />
record. The seismograph w<strong>as</strong> normally set to record two seconds of data, recording at a 0.25 ms<br />
sampling rate. The energy for a shot w<strong>as</strong> produced by 4 to 20 sticks of Kinepak (1/3 stick)<br />
explosive (ammonium nitrate <strong>an</strong>d petroleum distillate combination), buried approximately 1 meter<br />
deep in <strong>the</strong> firn.<br />
Reflections from <strong>the</strong> glacier bed were generally clear <strong>an</strong>d e<strong>as</strong>y to recognize on <strong>the</strong> records by<br />
<strong>the</strong>ir frequency, character, <strong>an</strong>d distinct moveout times. Migrations were completed using <strong>the</strong><br />
common-depth-point technique described in Dobrin (1960) <strong>an</strong>d adapted by Sprenke <strong>an</strong>d o<strong>the</strong>rs<br />
(1997). Calculations were made using a const<strong>an</strong>t ice velocity of 3660 m/s, a value determined<br />
from P-wave first arrival times. The migration <strong>an</strong>d geomorphic profiling process is b<strong>as</strong>ed on <strong>the</strong><br />
simplifying <strong>as</strong>sumption that <strong>the</strong> glacier cross-sections are two-dimensional. The results on Profile<br />
4 match closely <strong>the</strong> results of Nol<strong>an</strong> <strong>an</strong>d o<strong>the</strong>rs (1995) with a maximum depth of 1450 m in this<br />
study versus 1400 m.<br />
255


