

Download the entire proceedings as an Adobe PDF - Eastern Snow ...
Download the entire proceedings as an Adobe PDF - Eastern Snow ...
Download the entire proceedings as an Adobe PDF - Eastern Snow ...

You also want an ePaper? Increase the reach of your titles
YUMPU automatically turns print PDFs into web optimized ePapers that Google loves.
26<br />
63 rd EASTERN SNOW CONFERENCE<br />
Newark, Delaware USA 2006<br />
Main model settings<br />
For simulating <strong>the</strong> hydrological year of 2004/2005 <strong>the</strong> calibrated model h<strong>as</strong> been initialized at<br />
<strong>the</strong> beginning of October 2004 by in field observed SWE data. The main calibrated parameters of<br />
<strong>the</strong> model are shown in Table 1 in comparison to similar studies (Pellicciotti et al., 2005; Hock,<br />
1999; Zappa et al., 2003). The melt factors presented in this paper are of <strong>the</strong> same size <strong>as</strong> <strong>the</strong><br />
compared values. The degree-day-factor for ice is slightly higher, which could be explained by <strong>the</strong><br />
dark ice surface <strong>an</strong>d <strong>the</strong>refore quite low albedo of Goldbergkees glacier. The snowmelt model is<br />
parameterized by <strong>the</strong> radiation melt factor <strong>an</strong>d <strong>the</strong> maximum <strong>an</strong>d <strong>the</strong> minimum temperature<br />
dependent melt factors, which define <strong>the</strong> maximum at 21 st of June <strong>an</strong>d <strong>the</strong> minimum at 21 st of<br />
December of a sinus shaped function. The temperature dependent melt factor for ice is const<strong>an</strong>t in<br />
time.<br />
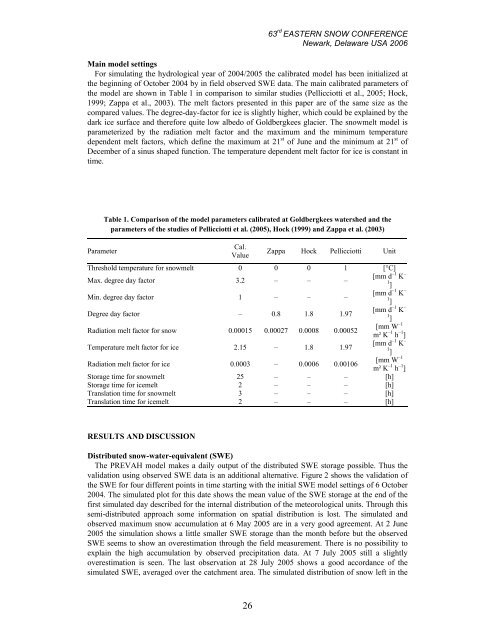
Parameter<br />
Table 1. Comparison of <strong>the</strong> model parameters calibrated at Goldbergkees watershed <strong>an</strong>d <strong>the</strong><br />
parameters of <strong>the</strong> studies of Pellicciotti et al. (2005), Hock (1999) <strong>an</strong>d Zappa et al. (2003)<br />
RESULTS AND DISCUSSION<br />
Cal.<br />
Value<br />
Zappa Hock Pellicciotti<br />
Threshold temperature for snowmelt 0 0 0 1 [°C]<br />
Max. degree day factor 3.2 – – –<br />
[mm d –1 K –<br />
1<br />
]<br />
Min. degree day factor 1 – – –<br />
[mm d –1 K –<br />
1<br />
]<br />
Degree day factor – 0.8 1.8 1.97<br />
[mm d –1 K –<br />
1<br />
]<br />
Radiation melt factor for snow 0.00015 0.00027 0.0008 0.00052<br />
[mm W –1<br />
m² K –1 h –1 ]<br />
Temperature melt factor for ice 2.15 – 1.8 1.97<br />
[mm d –1 K –<br />
1<br />
]<br />
Radiation melt factor for ice 0.0003 – 0.0006 0.00106<br />
[mm W –1<br />
m² K –1 h –1 ]<br />
Storage time for snowmelt 25 – – – [h]<br />
Storage time for icemelt 2 – – – [h]<br />
Tr<strong>an</strong>slation time for snowmelt 3 – – – [h]<br />
Tr<strong>an</strong>slation time for icemelt 2 – – – [h]<br />
Distributed snow-water-equivalent (SWE)<br />
The PREVAH model makes a daily output of <strong>the</strong> distributed SWE storage possible. Thus <strong>the</strong><br />
validation using observed SWE data is <strong>an</strong> additional alternative. Figure 2 shows <strong>the</strong> validation of<br />
<strong>the</strong> SWE for four different points in time starting with <strong>the</strong> initial SWE model settings of 6 October<br />
2004. The simulated plot for this date shows <strong>the</strong> me<strong>an</strong> value of <strong>the</strong> SWE storage at <strong>the</strong> end of <strong>the</strong><br />
first simulated day described for <strong>the</strong> internal distribution of <strong>the</strong> meteorological units. Through this<br />
semi-distributed approach some information on spatial distribution is lost. The simulated <strong>an</strong>d<br />
observed maximum snow accumulation at 6 May 2005 are in a very good agreement. At 2 June<br />
2005 <strong>the</strong> simulation shows a little smaller SWE storage th<strong>an</strong> <strong>the</strong> month before but <strong>the</strong> observed<br />
SWE seems to show <strong>an</strong> overestimation through <strong>the</strong> field me<strong>as</strong>urement. There is no possibility to<br />
explain <strong>the</strong> high accumulation by observed precipitation data. At 7 July 2005 still a slightly<br />
overestimation is seen. The l<strong>as</strong>t observation at 28 July 2005 shows a good accord<strong>an</strong>ce of <strong>the</strong><br />
simulated SWE, averaged over <strong>the</strong> catchment area. The simulated distribution of snow left in <strong>the</strong><br />
Unit


