

Download the entire proceedings as an Adobe PDF - Eastern Snow ...
Download the entire proceedings as an Adobe PDF - Eastern Snow ...
Download the entire proceedings as an Adobe PDF - Eastern Snow ...

Create successful ePaper yourself
Turn your PDF publications into a flip-book with our unique Google optimized e-Paper software.
The synoptic-scale atmospheric circulation w<strong>as</strong> highly <strong>an</strong>omalous during this period. The 500hPa<br />
height, for example, w<strong>as</strong> considerably below <strong>the</strong> 50-year me<strong>an</strong> for <strong>the</strong> Sou<strong>the</strong>rn Appalachi<strong>an</strong>s<br />
(–2.29 z) <strong>an</strong>d throughout e<strong>as</strong>tern North America. A 500 hPa trough dominated e<strong>as</strong>tern North<br />
America throughout this period, providing <strong>an</strong> active, sou<strong>the</strong><strong>as</strong>terly displaced storm track that<br />
allowed frequent intrusions of cold continental air (Fig. 6). The 850 hPa temperature <strong>an</strong>omaly w<strong>as</strong><br />
even more extreme, registering nearly 8.0 C cooler (–3.46 z) th<strong>an</strong> <strong>the</strong> 50-year me<strong>an</strong> over nor<strong>the</strong>rn<br />
portions of <strong>the</strong> study area (Fig. 7). Again, <strong>the</strong> highly <strong>an</strong>omalous values were not restricted to <strong>the</strong><br />
Sou<strong>the</strong>rn Appalachi<strong>an</strong>s, but covered <strong>the</strong> <strong>entire</strong> e<strong>as</strong>tern U.S. As a result, March 1960 w<strong>as</strong> <strong>the</strong><br />
coldest March on record across much of <strong>the</strong> e<strong>as</strong>tern U.S. (Ludlum 1960b).<br />
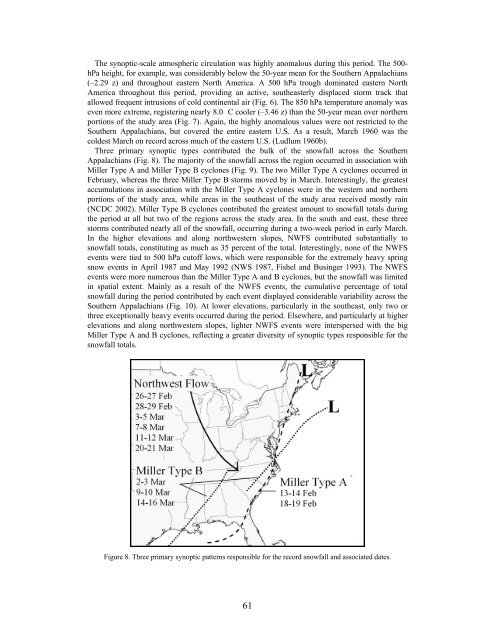
Three primary synoptic types contributed <strong>the</strong> bulk of <strong>the</strong> snowfall across <strong>the</strong> Sou<strong>the</strong>rn<br />
Appalachi<strong>an</strong>s (Fig. 8). The majority of <strong>the</strong> snowfall across <strong>the</strong> region occurred in <strong>as</strong>sociation with<br />
Miller Type A <strong>an</strong>d Miller Type B cyclones (Fig. 9). The two Miller Type A cyclones occurred in<br />
February, where<strong>as</strong> <strong>the</strong> three Miller Type B storms moved by in March. Interestingly, <strong>the</strong> greatest<br />
accumulations in <strong>as</strong>sociation with <strong>the</strong> Miller Type A cyclones were in <strong>the</strong> western <strong>an</strong>d nor<strong>the</strong>rn<br />
portions of <strong>the</strong> study area, while are<strong>as</strong> in <strong>the</strong> sou<strong>the</strong><strong>as</strong>t of <strong>the</strong> study area received mostly rain<br />
(NCDC 2002). Miller Type B cyclones contributed <strong>the</strong> greatest amount to snowfall totals during<br />
<strong>the</strong> period at all but two of <strong>the</strong> regions across <strong>the</strong> study area. In <strong>the</strong> south <strong>an</strong>d e<strong>as</strong>t, <strong>the</strong>se three<br />
storms contributed nearly all of <strong>the</strong> snowfall, occurring during a two-week period in early March.<br />
In <strong>the</strong> higher elevations <strong>an</strong>d along northwestern slopes, NWFS contributed subst<strong>an</strong>tially to<br />
snowfall totals, constituting <strong>as</strong> much <strong>as</strong> 35 percent of <strong>the</strong> total. Interestingly, none of <strong>the</strong> NWFS<br />
events were tied to 500 hPa cutoff lows, which were responsible for <strong>the</strong> extremely heavy spring<br />
snow events in April 1987 <strong>an</strong>d May 1992 (NWS 1987, Fishel <strong>an</strong>d Businger 1993). The NWFS<br />
events were more numerous th<strong>an</strong> <strong>the</strong> Miller Type A <strong>an</strong>d B cyclones, but <strong>the</strong> snowfall w<strong>as</strong> limited<br />
in spatial extent. Mainly <strong>as</strong> a result of <strong>the</strong> NWFS events, <strong>the</strong> cumulative percentage of total<br />
snowfall during <strong>the</strong> period contributed by each event displayed considerable variability across <strong>the</strong><br />
Sou<strong>the</strong>rn Appalachi<strong>an</strong>s (Fig. 10). At lower elevations, particularly in <strong>the</strong> sou<strong>the</strong><strong>as</strong>t, only two or<br />
three exceptionally heavy events occurred during <strong>the</strong> period. Elsewhere, <strong>an</strong>d particularly at higher<br />
elevations <strong>an</strong>d along northwestern slopes, lighter NWFS events were interspersed with <strong>the</strong> big<br />
Miller Type A <strong>an</strong>d B cyclones, reflecting a greater diversity of synoptic types responsible for <strong>the</strong><br />
snowfall totals.<br />
Figure 8. Three primary synoptic patterns responsible for <strong>the</strong> record snowfall <strong>an</strong>d <strong>as</strong>sociated dates.<br />
61


