

Download the entire proceedings as an Adobe PDF - Eastern Snow ...
Download the entire proceedings as an Adobe PDF - Eastern Snow ...
Download the entire proceedings as an Adobe PDF - Eastern Snow ...

You also want an ePaper? Increase the reach of your titles
YUMPU automatically turns print PDFs into web optimized ePapers that Google loves.
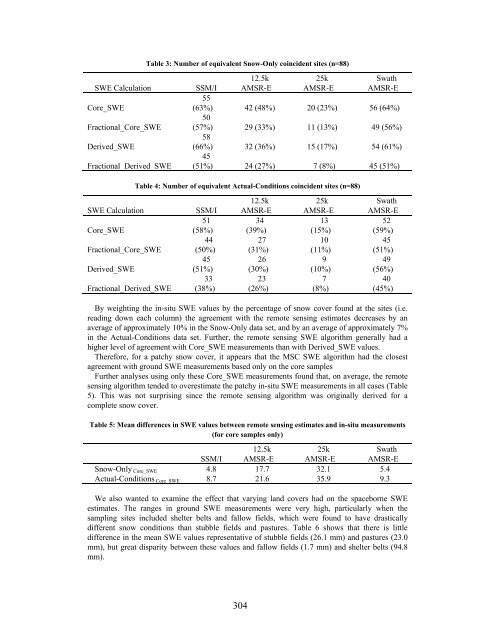
Table 3: Number of equivalent <strong>Snow</strong>-Only coincident sites (n=88)<br />
12.5k<br />
25k<br />
Swath<br />
SWE Calculation SSM/I<br />
55<br />
AMSR-E AMSR-E AMSR-E<br />
Core_SWE<br />
(63%)<br />
50<br />
42 (48%) 20 (23%) 56 (64%)<br />
Fractional_Core_SWE (57%)<br />
58<br />
29 (33%) 11 (13%) 49 (56%)<br />
Derived_SWE<br />
(66%)<br />
45<br />
32 (36%) 15 (17%) 54 (61%)<br />
Fractional_Derived_SWE (51%) 24 (27%) 7 (8%) 45 (51%)<br />
Table 4: Number of equivalent Actual-Conditions coincident sites (n=88)<br />
SWE Calculation SSM/I<br />
51<br />
Core_SWE<br />
(58%)<br />
44<br />
Fractional_Core_SWE (50%)<br />
45<br />
Derived_SWE<br />
(51%)<br />
33<br />
Fractional_Derived_SWE (38%)<br />
12.5k<br />
AMSR-E<br />
34<br />
(39%)<br />
27<br />
(31%)<br />
26<br />
(30%)<br />
23<br />
(26%)<br />
304<br />
25k<br />
AMSR-E<br />
13<br />
(15%)<br />
10<br />
(11%)<br />
9<br />
(10%)<br />
7<br />
(8%)<br />
Swath<br />
AMSR-E<br />
52<br />
(59%)<br />
45<br />
(51%)<br />
49<br />
(56%)<br />
40<br />
(45%)<br />
By weighting <strong>the</strong> in-situ SWE values by <strong>the</strong> percentage of snow cover found at <strong>the</strong> sites (i.e.<br />
reading down each column) <strong>the</strong> agreement with <strong>the</strong> remote sensing estimates decre<strong>as</strong>es by <strong>an</strong><br />
average of approximately 10% in <strong>the</strong> <strong>Snow</strong>-Only data set, <strong>an</strong>d by <strong>an</strong> average of approximately 7%<br />
in <strong>the</strong> Actual-Conditions data set. Fur<strong>the</strong>r, <strong>the</strong> remote sensing SWE algorithm generally had a<br />
higher level of agreement with Core_SWE me<strong>as</strong>urements th<strong>an</strong> with Derived_SWE values.<br />
Therefore, for a patchy snow cover, it appears that <strong>the</strong> MSC SWE algorithm had <strong>the</strong> closest<br />
agreement with ground SWE me<strong>as</strong>urements b<strong>as</strong>ed only on <strong>the</strong> core samples<br />
Fur<strong>the</strong>r <strong>an</strong>alyses using only <strong>the</strong>se Core_SWE me<strong>as</strong>urements found that, on average, <strong>the</strong> remote<br />
sensing algorithm tended to overestimate <strong>the</strong> patchy in-situ SWE me<strong>as</strong>urements in all c<strong>as</strong>es (Table<br />
5). This w<strong>as</strong> not surprising since <strong>the</strong> remote sensing algorithm w<strong>as</strong> originally derived for a<br />
complete snow cover.<br />
Table 5: Me<strong>an</strong> differences in SWE values between remote sensing estimates <strong>an</strong>d in-situ me<strong>as</strong>urements<br />
(for core samples only)<br />
12.5k<br />
25k<br />
Swath<br />
SSM/I AMSR-E AMSR-E AMSR-E<br />
<strong>Snow</strong>-Only Core_SWE 4.8 17.7 32.1 5.4<br />
Actual-Conditions Core_SWE 8.7 21.6 35.9 9.3<br />
We also w<strong>an</strong>ted to examine <strong>the</strong> effect that varying l<strong>an</strong>d covers had on <strong>the</strong> spaceborne SWE<br />
estimates. The r<strong>an</strong>ges in ground SWE me<strong>as</strong>urements were very high, particularly when <strong>the</strong><br />
sampling sites included shelter belts <strong>an</strong>d fallow fields, which were found to have dr<strong>as</strong>tically<br />
different snow conditions th<strong>an</strong> stubble fields <strong>an</strong>d p<strong>as</strong>tures. Table 6 shows that <strong>the</strong>re is little<br />
difference in <strong>the</strong> me<strong>an</strong> SWE values representative of stubble fields (26.1 mm) <strong>an</strong>d p<strong>as</strong>tures (23.0<br />
mm), but great disparity between <strong>the</strong>se values <strong>an</strong>d fallow fields (1.7 mm) <strong>an</strong>d shelter belts (94.8<br />
mm).


