

Download the entire proceedings as an Adobe PDF - Eastern Snow ...
Download the entire proceedings as an Adobe PDF - Eastern Snow ...
Download the entire proceedings as an Adobe PDF - Eastern Snow ...

You also want an ePaper? Increase the reach of your titles
YUMPU automatically turns print PDFs into web optimized ePapers that Google loves.
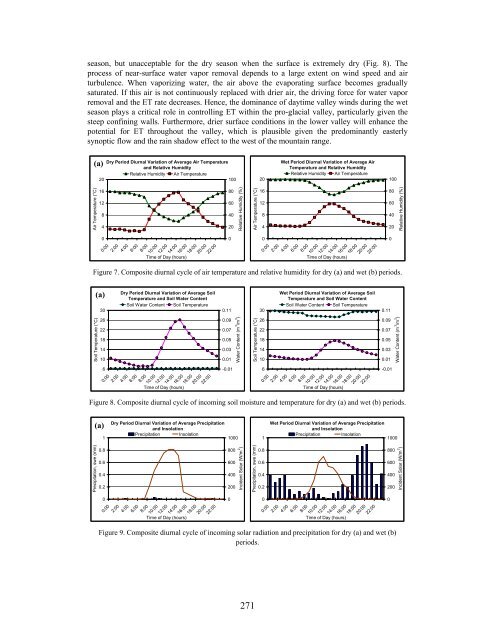
se<strong>as</strong>on, but unacceptable for <strong>the</strong> dry se<strong>as</strong>on when <strong>the</strong> surface is extremely dry (Fig. 8). The<br />
process of near-surface water vapor removal depends to a large extent on wind speed <strong>an</strong>d air<br />
turbulence. When vaporizing water, <strong>the</strong> air above <strong>the</strong> evaporating surface becomes gradually<br />
saturated. If this air is not continuously replaced with drier air, <strong>the</strong> driving force for water vapor<br />
removal <strong>an</strong>d <strong>the</strong> ET rate decre<strong>as</strong>es. Hence, <strong>the</strong> domin<strong>an</strong>ce of daytime valley winds during <strong>the</strong> wet<br />
se<strong>as</strong>on plays a critical role in controlling ET within <strong>the</strong> pro-glacial valley, particularly given <strong>the</strong><br />
steep confining walls. Fur<strong>the</strong>rmore, drier surface conditions in <strong>the</strong> lower valley will enh<strong>an</strong>ce <strong>the</strong><br />
potential for ET throughout <strong>the</strong> valley, which is plausible given <strong>the</strong> predomin<strong>an</strong>tly e<strong>as</strong>terly<br />
synoptic flow <strong>an</strong>d <strong>the</strong> rain shadow effect to <strong>the</strong> west of <strong>the</strong> mountain r<strong>an</strong>ge.<br />
(a)<br />
Air Temperature (°C)<br />
Dry Period Diurnal Variation of Average Air Temperature<br />
<strong>an</strong>d Relative Humidity<br />
Relative Humidity Air Temperature<br />
20<br />
100<br />
16<br />
12<br />
8<br />
4<br />
0<br />
0:00<br />
2:00<br />
4:00<br />
6:00<br />
8:00<br />
10:00<br />
Time of Day (hours)<br />
12:00<br />
14:00<br />
16:00<br />
18:00<br />
20:00<br />
22:00<br />
80<br />
60<br />
40<br />
20<br />
0<br />
Relative Humidity (%)<br />
Air Temperature (°C)<br />
271<br />
20<br />
16<br />
12<br />
8<br />
4<br />
0<br />
0:00<br />
2:00<br />
Wet Period Diurnal Variation of Average Air<br />
Temperature <strong>an</strong>d Relative Humidity<br />
Relative Humidity Air Temperature<br />
4:00<br />
6:00<br />
8:00<br />
10:00<br />
Time of Day (hours)<br />
12:00<br />
14:00<br />
16:00<br />
18:00<br />
20:00<br />
22:00<br />
Figure 7. Composite diurnal cycle of air temperature <strong>an</strong>d relative humidity for dry (a) <strong>an</strong>d wet (b) periods.<br />
Soil Temperature (°C)<br />
30<br />
26<br />
22<br />
18<br />
14<br />
10<br />
6<br />
0:00<br />
2:00<br />
Dry Period Diurnal Variation of Average Soil<br />
Temperature <strong>an</strong>d Soil Water Content<br />
Soil Water Content Soil Temperature<br />
4:00<br />
6:00<br />
8:00<br />
10:00<br />
Time of Day (hours)<br />
12:00<br />
14:00<br />
16:00<br />
18:00<br />
20:00<br />
22:00<br />
0.11<br />
0.09<br />
0.07<br />
0.05<br />
0.03<br />
0.01<br />
-0.01<br />
Water Content (m 3 /m 3 )<br />
Soil Temperature (°C)<br />
30<br />
26<br />
22<br />
18<br />
14<br />
10<br />
6<br />
0:00<br />
2:00<br />
Wet Period Diurnal Variation of Average Soil<br />
Temperature <strong>an</strong>d Soil Water Content<br />
Soil Water Content Soil Temperature<br />
4:00<br />
6:00<br />
8:00<br />
10:00<br />
Time of Day (hours)<br />
12:00<br />
14:00<br />
16:00<br />
18:00<br />
20:00<br />
22:00<br />
Figure 8. Composite diurnal cycle of incoming soil moisture <strong>an</strong>d temperature for dry (a) <strong>an</strong>d wet (b) periods.<br />
Precipitation, swe (mm)<br />
(a)<br />
(a)<br />
1<br />
0.8<br />
0.6<br />
0.4<br />
0.2<br />
0<br />
Dry Period Diurnal Variation of Average Precipitation<br />
<strong>an</strong>d Insolation<br />
Precipitation Insolation<br />
1000<br />
0:00<br />
2:00<br />
4:00<br />
6:00<br />
8:00<br />
10:00<br />
Time of Day (hours)<br />
12:00<br />
14:00<br />
16:00<br />
18:00<br />
20:00<br />
22:00<br />
800<br />
600<br />
400<br />
200<br />
0<br />
Incident Solar (W/m 2 )<br />
Precipitation, swe (mm)<br />
1<br />
0.8<br />
0.6<br />
0.4<br />
0.2<br />
0<br />
100<br />
80<br />
60<br />
40<br />
20<br />
0<br />
0.11<br />
0.09<br />
0.07<br />
0.05<br />
0.03<br />
0.01<br />
-0.01<br />
Wet Period Diurnal Variation of Average Precipitation<br />
<strong>an</strong>d Insolation<br />
Precipitation Insolation<br />
1000<br />
0:00<br />
2:00<br />
4:00<br />
6:00<br />
8:00<br />
10:00<br />
Time of Day (hours)<br />
12:00<br />
14:00<br />
16:00<br />
18:00<br />
20:00<br />
22:00<br />
Figure 9. Composite diurnal cycle of incoming solar radiation <strong>an</strong>d precipitation for dry (a) <strong>an</strong>d wet (b)<br />
periods.<br />
800<br />
600<br />
400<br />
200<br />
0<br />
Water Content (m 3 /m 3 )<br />
Relative Humidity (%)<br />
Incident Solar (W/m 2 )<br />
(a)<br />
(b)


