

Download the entire proceedings as an Adobe PDF - Eastern Snow ...
Download the entire proceedings as an Adobe PDF - Eastern Snow ...
Download the entire proceedings as an Adobe PDF - Eastern Snow ...

Create successful ePaper yourself
Turn your PDF publications into a flip-book with our unique Google optimized e-Paper software.
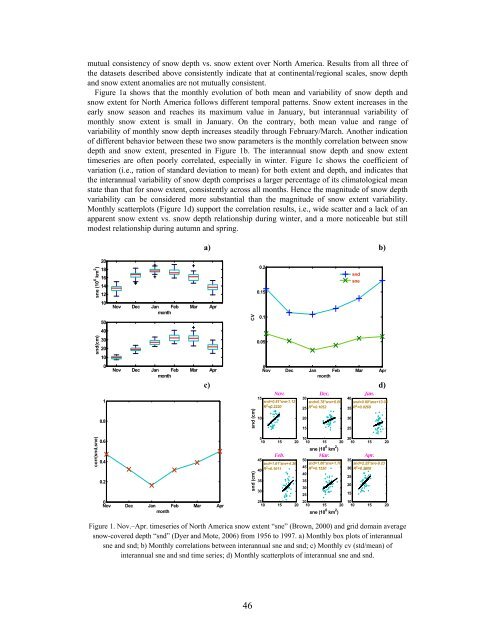
mutual consistency of snow depth vs. snow extent over North America. Results from all three of<br />
<strong>the</strong> dat<strong>as</strong>ets described above consistently indicate that at continental/regional scales, snow depth<br />
<strong>an</strong>d snow extent <strong>an</strong>omalies are not mutually consistent.<br />
Figure 1a shows that <strong>the</strong> monthly evolution of both me<strong>an</strong> <strong>an</strong>d variability of snow depth <strong>an</strong>d<br />
snow extent for North America follows different temporal patterns. <strong>Snow</strong> extent incre<strong>as</strong>es in <strong>the</strong><br />
early snow se<strong>as</strong>on <strong>an</strong>d reaches its maximum value in J<strong>an</strong>uary, but inter<strong>an</strong>nual variability of<br />
monthly snow extent is small in J<strong>an</strong>uary. On <strong>the</strong> contrary, both me<strong>an</strong> value <strong>an</strong>d r<strong>an</strong>ge of<br />
variability of monthly snow depth incre<strong>as</strong>es steadily through February/March. Ano<strong>the</strong>r indication<br />
of different behavior between <strong>the</strong>se two snow parameters is <strong>the</strong> monthly correlation between snow<br />
depth <strong>an</strong>d snow extent, presented in Figure 1b. The inter<strong>an</strong>nual snow depth <strong>an</strong>d snow extent<br />
timeseries are often poorly correlated, especially in winter. Figure 1c shows <strong>the</strong> coefficient of<br />
variation (i.e., ration of st<strong>an</strong>dard deviation to me<strong>an</strong>) for both extent <strong>an</strong>d depth, <strong>an</strong>d indicates that<br />
<strong>the</strong> inter<strong>an</strong>nual variability of snow depth comprises a larger percentage of its climatological me<strong>an</strong><br />
state th<strong>an</strong> that for snow extent, consistently across all months. Hence <strong>the</strong> magnitude of snow depth<br />
variability c<strong>an</strong> be considered more subst<strong>an</strong>tial th<strong>an</strong> <strong>the</strong> magnitude of snow extent variability.<br />
Monthly scatterplots (Figure 1d) support <strong>the</strong> correlation results, i.e., wide scatter <strong>an</strong>d a lack of <strong>an</strong><br />
apparent snow extent vs. snow depth relationship during winter, <strong>an</strong>d a more noticeable but still<br />
modest relationship during autumn <strong>an</strong>d spring.<br />
sne (10 6 km 2 )<br />
snd(cm)<br />
corr(snd,sne)<br />
20<br />
18<br />
16<br />
14<br />
12<br />
10<br />
50<br />
40<br />
30<br />
20<br />
10<br />
0<br />
1<br />
0.8<br />
0.6<br />
0.4<br />
0.2<br />
Nov Dec J<strong>an</strong> Feb Mar Apr<br />
month<br />
Nov Dec J<strong>an</strong> Feb Mar Apr<br />
month<br />
0<br />
Nov Dec J<strong>an</strong> Feb Mar Apr<br />
month<br />
a) b)<br />
c) d)<br />
Figure 1. Nov.–Apr. timeseries of North America snow extent “sne” (Brown, 2000) <strong>an</strong>d grid domain average<br />
snow-covered depth “snd” (Dyer <strong>an</strong>d Mote, 2006) from 1956 to 1997. a) Monthly box plots of inter<strong>an</strong>nual<br />
sne <strong>an</strong>d snd; b) Monthly correlations between inter<strong>an</strong>nual sne <strong>an</strong>d snd; c) Monthly cv (std/me<strong>an</strong>) of<br />
inter<strong>an</strong>nual sne <strong>an</strong>d snd time series; d) Monthly scatterplots of inter<strong>an</strong>nual sne <strong>an</strong>d snd.<br />
CV<br />
snd (cm)<br />
snd (cm)<br />
46<br />
0.2<br />
0.15<br />
0.1<br />
0.05<br />
0<br />
Nov Dec J<strong>an</strong> Feb Mar Apr<br />
month<br />
15<br />
snd=0.81*sne-1.12<br />
R2 Nov.<br />
=0.2220<br />
10<br />
5<br />
10 15 20<br />
45<br />
snd=1.61*sne+4.36<br />
40 R2 Feb.<br />
=0.1011<br />
35<br />
30<br />
25<br />
10 15 20<br />
30<br />
snd=0.78*sne+6.09<br />
25 R2 Dec.<br />
=0.1052<br />
20<br />
15<br />
50<br />
snd=1.86*sne+1.76<br />
45 R<br />
40<br />
35<br />
30<br />
25<br />
20<br />
10 15 20<br />
2 =0.1530<br />
sne (10 6 km 2 10<br />
10 15 20<br />
sne (10<br />
Mar.<br />
)<br />
6 km 2 )<br />
40<br />
snd=0.80*sne+13.05<br />
35 R2 J<strong>an</strong>.<br />
=0.0269<br />
30<br />
25<br />
20<br />
10 15 20<br />
35<br />
snd=2.25*sne-9.23<br />
30 R2 Apr.<br />
=0.2508<br />
25<br />
20<br />
15<br />
snd<br />
sne<br />
10<br />
10 15 20


