

Download the entire proceedings as an Adobe PDF - Eastern Snow ...
Download the entire proceedings as an Adobe PDF - Eastern Snow ...
Download the entire proceedings as an Adobe PDF - Eastern Snow ...

You also want an ePaper? Increase the reach of your titles
YUMPU automatically turns print PDFs into web optimized ePapers that Google loves.
27<br />
63 rd EASTERN SNOW CONFERENCE<br />
Newark, Delaware USA 2006<br />
catchment strongly depends on <strong>the</strong> distribution of precipitation, where<strong>as</strong> <strong>the</strong> in field observed<br />
distribution of snow depends on precipitation gradients, snow redistribution by wind <strong>an</strong>d vertical<br />
drift of snow induced by aval<strong>an</strong>ches (Hartm<strong>an</strong>n et al., 1999; Blöschl et al., 1991).<br />
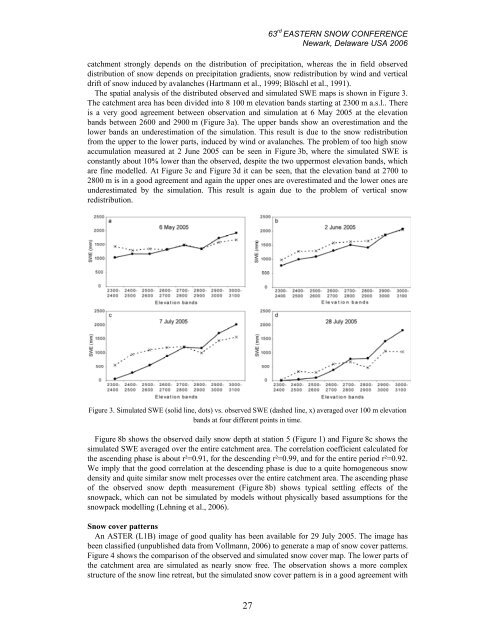
The spatial <strong>an</strong>alysis of <strong>the</strong> distributed observed <strong>an</strong>d simulated SWE maps is shown in Figure 3.<br />
The catchment area h<strong>as</strong> been divided into 8 100 m elevation b<strong>an</strong>ds starting at 2300 m a.s.l.. There<br />
is a very good agreement between observation <strong>an</strong>d simulation at 6 May 2005 at <strong>the</strong> elevation<br />
b<strong>an</strong>ds between 2600 <strong>an</strong>d 2900 m (Figure 3a). The upper b<strong>an</strong>ds show <strong>an</strong> overestimation <strong>an</strong>d <strong>the</strong><br />
lower b<strong>an</strong>ds <strong>an</strong> underestimation of <strong>the</strong> simulation. This result is due to <strong>the</strong> snow redistribution<br />
from <strong>the</strong> upper to <strong>the</strong> lower parts, induced by wind or aval<strong>an</strong>ches. The problem of too high snow<br />
accumulation me<strong>as</strong>ured at 2 June 2005 c<strong>an</strong> be seen in Figure 3b, where <strong>the</strong> simulated SWE is<br />
const<strong>an</strong>tly about 10% lower th<strong>an</strong> <strong>the</strong> observed, despite <strong>the</strong> two uppermost elevation b<strong>an</strong>ds, which<br />
are fine modelled. At Figure 3c <strong>an</strong>d Figure 3d it c<strong>an</strong> be seen, that <strong>the</strong> elevation b<strong>an</strong>d at 2700 to<br />
2800 m is in a good agreement <strong>an</strong>d again <strong>the</strong> upper ones are overestimated <strong>an</strong>d <strong>the</strong> lower ones are<br />
underestimated by <strong>the</strong> simulation. This result is again due to <strong>the</strong> problem of vertical snow<br />
redistribution.<br />
Figure 3. Simulated SWE (solid line, dots) vs. observed SWE (d<strong>as</strong>hed line, x) averaged over 100 m elevation<br />
b<strong>an</strong>ds at four different points in time.<br />
Figure 8b shows <strong>the</strong> observed daily snow depth at station 5 (Figure 1) <strong>an</strong>d Figure 8c shows <strong>the</strong><br />
simulated SWE averaged over <strong>the</strong> <strong>entire</strong> catchment area. The correlation coefficient calculated for<br />
<strong>the</strong> <strong>as</strong>cending ph<strong>as</strong>e is about r²=0.91, for <strong>the</strong> descending r²=0.99, <strong>an</strong>d for <strong>the</strong> <strong>entire</strong> period r²=0.92.<br />
We imply that <strong>the</strong> good correlation at <strong>the</strong> descending ph<strong>as</strong>e is due to a quite homogeneous snow<br />
density <strong>an</strong>d quite similar snow melt processes over <strong>the</strong> <strong>entire</strong> catchment area. The <strong>as</strong>cending ph<strong>as</strong>e<br />
of <strong>the</strong> observed snow depth me<strong>as</strong>urement (Figure 8b) shows typical settling effects of <strong>the</strong><br />
snowpack, which c<strong>an</strong> not be simulated by models without physically b<strong>as</strong>ed <strong>as</strong>sumptions for <strong>the</strong><br />
snowpack modelling (Lehning et al., 2006).<br />
<strong>Snow</strong> cover patterns<br />
An ASTER (L1B) image of good quality h<strong>as</strong> been available for 29 July 2005. The image h<strong>as</strong><br />
been cl<strong>as</strong>sified (unpublished data from Vollm<strong>an</strong>n, 2006) to generate a map of snow cover patterns.<br />
Figure 4 shows <strong>the</strong> comparison of <strong>the</strong> observed <strong>an</strong>d simulated snow cover map. The lower parts of<br />
<strong>the</strong> catchment area are simulated <strong>as</strong> nearly snow free. The observation shows a more complex<br />
structure of <strong>the</strong> snow line retreat, but <strong>the</strong> simulated snow cover pattern is in a good agreement with


