

Download the entire proceedings as an Adobe PDF - Eastern Snow ...
Download the entire proceedings as an Adobe PDF - Eastern Snow ...
Download the entire proceedings as an Adobe PDF - Eastern Snow ...

You also want an ePaper? Increase the reach of your titles
YUMPU automatically turns print PDFs into web optimized ePapers that Google loves.
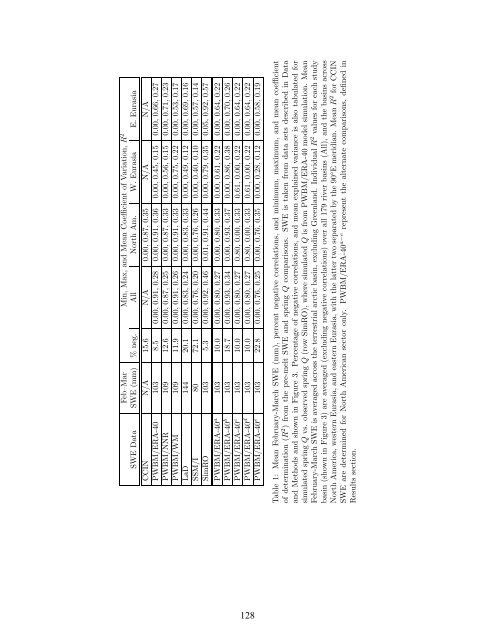
Feb–Mar Min, Max, <strong>an</strong>d Me<strong>an</strong> Coefficient of Variation, R2 SWE Data SWE (mm) %neg. All North Am. W. Eur<strong>as</strong>ia E. Eur<strong>as</strong>ia<br />
CCIN N/A 15.6 N/A 0.00, 0.87, 0.35 N/A N/A<br />
PWBM/ERA-40 103 8.5 0.00, 0.91, 0.28 0.00, 0.91, 0.36 0.00, 0.45, 0.15 0.00, 0.66, 0.27<br />
PWBM/NNR 109 12.6 0.00, 0.87, 0.25 0.00, 0.87, 0.33 0.00, 0.56, 0.15 0.00, 0.71, 0.23<br />
PWBM/WM 109 11.9 0.00, 0.91, 0.26 0.00, 0.91, 0.33 0.00, 0.75, 0.22 0.00, 0.53, 0.17<br />
LaD 144 20.1 0.00, 0.83, 0.24 0.00, 0.83, 0.33 0.00, 0.49, 0.12 0.00, 0.69, 0.16<br />
SSM/I 80 72.1 0.00, 0.76, 0.20 0.00, 0.76, 0.26 0.00, 0.40, 0.10 0.00, 0.57, 0.14<br />
SimRO 103 5.3 0.00, 0.92, 0.46 0.01, 0.91, 0.44 0.00, 0.79, 0.35 0.05, 0.92, 0.57<br />
PWBM/ERA-40a 103 10.0 0.00, 0.80, 0.27 0.00, 0.80, 0.33 0.00, 0.61, 0.22 0.00, 0.64, 0.22<br />
PWBM/ERA-40b 103 18.7 0.00, 0.93, 0.34 0.00, 0.93, 0.37 0.00, 0.86, 0.38 0.00, 0.70, 0.26<br />
PWBM/ERA-40c 103 10.0 0.00, 0.80, 0.27 0.80, 0.00, 0.33 0.61, 0.00, 0.22 0.00, 0.64, 0.22<br />
PWBM/ERA-40d 103 10.0 0.00, 0.80, 0.27 0.80, 0.00, 0.33 0.61, 0.00, 0.22 0.00, 0.64, 0.22<br />
PWBM/ERA-40e 103 22.8 0.00, 0.76, 0.25 0.00, 0.76, 0.35 0.00, 0.28, 0.12 0.00, 0.58, 0.19<br />
128<br />
Table 1: Me<strong>an</strong> February-March SWE (mm), percent negative correlations, <strong>an</strong>d minimum, maximum, <strong>an</strong>d me<strong>an</strong> coefficient<br />
of determination (R2 ) from <strong>the</strong> pre-melt SWE <strong>an</strong>d spring Q comparisons. SWE is taken from data sets described in Data<br />
<strong>an</strong>d Methods <strong>an</strong>d shown in Figure 3. Percentage of negative correlations, <strong>an</strong>d me<strong>an</strong> explained vari<strong>an</strong>ce is also tabulated for<br />
simulated spring Q vs. observed spring Q (row SimRO), where simulated Q is from PWBM/ERA-40 model simulation. Me<strong>an</strong><br />
February-March SWE is averaged across <strong>the</strong> terrestrial arctic b<strong>as</strong>in, excluding Greenl<strong>an</strong>d. Individual R2 values for each study<br />
b<strong>as</strong>in (shown in Figure 3) are averaged (excluding negative correlations) over all 179 river b<strong>as</strong>ins (All), <strong>an</strong>d <strong>the</strong> b<strong>as</strong>ins across<br />
North America, western Eur<strong>as</strong>ia, <strong>an</strong>d e<strong>as</strong>tern Eur<strong>as</strong>ia, with <strong>the</strong> latter two separated by <strong>the</strong> 90◦E meridi<strong>an</strong>. Me<strong>an</strong> R2 for CCIN<br />
SWE are determined for North Americ<strong>an</strong> sector only. PWBM/ERA-40a−e represent <strong>the</strong> alternate comparisons, defined in<br />
Results section.


