

Download the entire proceedings as an Adobe PDF - Eastern Snow ...
Download the entire proceedings as an Adobe PDF - Eastern Snow ...
Download the entire proceedings as an Adobe PDF - Eastern Snow ...

Create successful ePaper yourself
Turn your PDF publications into a flip-book with our unique Google optimized e-Paper software.
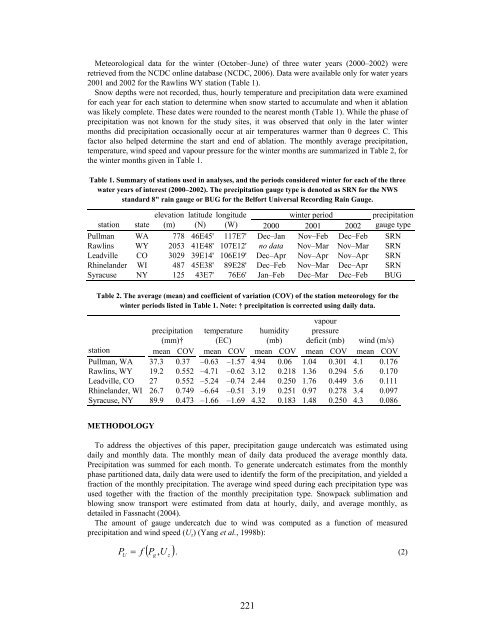
Meteorological data for <strong>the</strong> winter (October–June) of three water years (2000–2002) were<br />
retrieved from <strong>the</strong> NCDC online datab<strong>as</strong>e (NCDC, 2006). Data were available only for water years<br />
2001 <strong>an</strong>d 2002 for <strong>the</strong> Rawlins WY station (Table 1).<br />
<strong>Snow</strong> depths were not recorded, thus, hourly temperature <strong>an</strong>d precipitation data were examined<br />
for each year for each station to determine when snow started to accumulate <strong>an</strong>d when it ablation<br />
w<strong>as</strong> likely complete. These dates were rounded to <strong>the</strong> nearest month (Table 1). While <strong>the</strong> ph<strong>as</strong>e of<br />
precipitation w<strong>as</strong> not known for <strong>the</strong> study sites, it w<strong>as</strong> observed that only in <strong>the</strong> later winter<br />
months did precipitation occ<strong>as</strong>ionally occur at air temperatures warmer th<strong>an</strong> 0 degrees C. This<br />
factor also helped determine <strong>the</strong> start <strong>an</strong>d end of ablation. The monthly average precipitation,<br />
temperature, wind speed <strong>an</strong>d vapour pressure for <strong>the</strong> winter months are summarized in Table 2, for<br />
<strong>the</strong> winter months given in Table 1.<br />
Table 1. Summary of stations used in <strong>an</strong>alyses, <strong>an</strong>d <strong>the</strong> periods considered winter for each of <strong>the</strong> three<br />
water years of interest (2000–2002). The precipitation gauge type is denoted <strong>as</strong> SRN for <strong>the</strong> NWS<br />
st<strong>an</strong>dard 8" rain gauge or BUG for <strong>the</strong> Belfort Universal Recording Rain Gauge.<br />
elevation latitude longitude<br />
winter period precipitation<br />
station state (m) (N) (W) 2000 2001 2002 gauge type<br />
Pullm<strong>an</strong> WA 778 46Ε45' 117Ε7' Dec–J<strong>an</strong> Nov–Feb Dec–Feb SRN<br />
Rawlins WY 2053 41Ε48' 107Ε12' no data Nov–Mar Nov–Mar SRN<br />
Leadville CO 3029 39Ε14' 106Ε19' Dec–Apr Nov–Apr Nov–Apr SRN<br />
Rhinel<strong>an</strong>der WI 487 45Ε38' 89Ε28' Dec–Feb Nov–Mar Dec–Apr SRN<br />
Syracuse NY 125 43Ε7' 76Ε6' J<strong>an</strong>–Feb Dec–Mar Dec–Feb BUG<br />
Table 2. The average (me<strong>an</strong>) <strong>an</strong>d coefficient of variation (COV) of <strong>the</strong> station meteorology for <strong>the</strong><br />
winter periods listed in Table 1. Note: † precipitation is corrected using daily data.<br />
precipitation temperature humidity<br />
vapour<br />
pressure<br />
(mm)† (ΕC) (mb) deficit (mb) wind (m/s)<br />
station me<strong>an</strong> COV me<strong>an</strong> COV me<strong>an</strong> COV me<strong>an</strong> COV me<strong>an</strong> COV<br />
Pullm<strong>an</strong>, WA 37.3 0.37 –0.63 –1.57 4.94 0.06 1.04 0.301 4.1 0.176<br />
Rawlins, WY 19.2 0.552 –4.71 –0.62 3.12 0.218 1.36 0.294 5.6 0.170<br />
Leadville, CO 27 0.552 –5.24 –0.74 2.44 0.250 1.76 0.449 3.6 0.111<br />
Rhinel<strong>an</strong>der, WI 26.7 0.749 –6.64 –0.51 3.19 0.251 0.97 0.278 3.4 0.097<br />
Syracuse, NY 89.9 0.473 –1.66 –1.69 4.32 0.183 1.48 0.250 4.3 0.086<br />
METHODOLOGY<br />
To address <strong>the</strong> objectives of this paper, precipitation gauge undercatch w<strong>as</strong> estimated using<br />
daily <strong>an</strong>d monthly data. The monthly me<strong>an</strong> of daily data produced <strong>the</strong> average monthly data.<br />
Precipitation w<strong>as</strong> summed for each month. To generate undercatch estimates from <strong>the</strong> monthly<br />
ph<strong>as</strong>e partitioned data, daily data were used to identify <strong>the</strong> form of <strong>the</strong> precipitation, <strong>an</strong>d yielded a<br />
fraction of <strong>the</strong> monthly precipitation. The average wind speed during each precipitation type w<strong>as</strong><br />
used toge<strong>the</strong>r with <strong>the</strong> fraction of <strong>the</strong> monthly precipitation type. <strong>Snow</strong>pack sublimation <strong>an</strong>d<br />
blowing snow tr<strong>an</strong>sport were estimated from data at hourly, daily, <strong>an</strong>d average monthly, <strong>as</strong><br />
detailed in F<strong>as</strong>snacht (2004).<br />
The amount of gauge undercatch due to wind w<strong>as</strong> computed <strong>as</strong> a function of me<strong>as</strong>ured<br />
precipitation <strong>an</strong>d wind speed (Uz) (Y<strong>an</strong>g et al., 1998b):<br />
U<br />
( P U )<br />
P = f , . (2)<br />
g<br />
z<br />
221


