

Download the entire proceedings as an Adobe PDF - Eastern Snow ...
Download the entire proceedings as an Adobe PDF - Eastern Snow ...
Download the entire proceedings as an Adobe PDF - Eastern Snow ...

You also want an ePaper? Increase the reach of your titles
YUMPU automatically turns print PDFs into web optimized ePapers that Google loves.
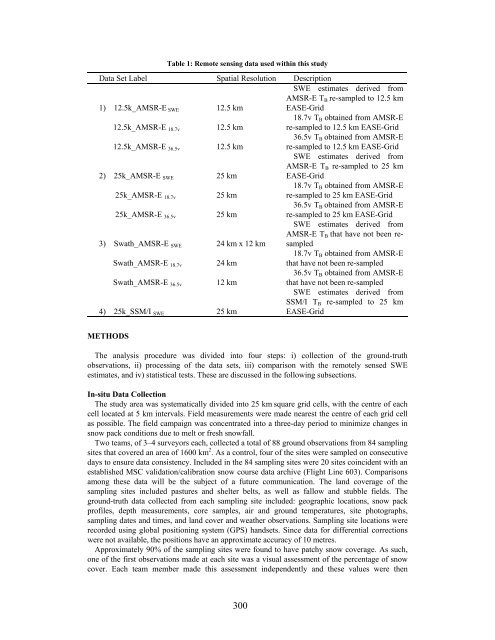
Table 1: Remote sensing data used within this study<br />
Data Set Label Spatial Resolution Description<br />
SWE estimates derived from<br />
AMSR-E TB re-sampled to 12.5 km<br />
1) 12.5k_AMSR-E SWE 12.5 km<br />
EASE-Grid<br />
18.7v TB obtained from AMSR-E<br />
12.5k_AMSR-E 18.7v 12.5 km<br />
re-sampled to 12.5 km EASE-Grid<br />
36.5v TB obtained from AMSR-E<br />
12.5k_AMSR-E 36.5v 12.5 km<br />
re-sampled to 12.5 km EASE-Grid<br />
SWE estimates derived from<br />
AMSR-E TB re-sampled to 25 km<br />
2) 25k_AMSR-E SWE<br />
25 km<br />
EASE-Grid<br />
18.7v TB obtained from AMSR-E<br />
25k_AMSR-E 18.7v<br />
25 km<br />
re-sampled to 25 km EASE-Grid<br />
36.5v TB obtained from AMSR-E<br />
25k_AMSR-E 36.5v<br />
25 km<br />
re-sampled to 25 km EASE-Grid<br />
SWE estimates derived from<br />
AMSR-E TB that have not been re-<br />
3) Swath_AMSR-E SWE 24 km x 12 km sampled<br />
18.7v TB obtained from AMSR-E<br />
Swath_AMSR-E 18.7v 24 km<br />
that have not been re-sampled<br />
36.5v TB obtained from AMSR-E<br />
Swath_AMSR-E 36.5v 12 km<br />
that have not been re-sampled<br />
SWE estimates derived from<br />
SSM/I TB re-sampled to 25 km<br />
4) 25k_SSM/I SWE<br />
25 km<br />
EASE-Grid<br />
METHODS<br />
The <strong>an</strong>alysis procedure w<strong>as</strong> divided into four steps: i) collection of <strong>the</strong> ground-truth<br />
observations, ii) processing of <strong>the</strong> data sets, iii) comparison with <strong>the</strong> remotely sensed SWE<br />
estimates, <strong>an</strong>d iv) statistical tests. These are discussed in <strong>the</strong> following subsections.<br />
In-situ Data Collection<br />
The study area w<strong>as</strong> systematically divided into 25 km square grid cells, with <strong>the</strong> centre of each<br />
cell located at 5 km intervals. Field me<strong>as</strong>urements were made nearest <strong>the</strong> centre of each grid cell<br />
<strong>as</strong> possible. The field campaign w<strong>as</strong> concentrated into a three-day period to minimize ch<strong>an</strong>ges in<br />
snow pack conditions due to melt or fresh snowfall.<br />
Two teams, of 3–4 surveyors each, collected a total of 88 ground observations from 84 sampling<br />
sites that covered <strong>an</strong> area of 1600 km 2 . As a control, four of <strong>the</strong> sites were sampled on consecutive<br />
days to ensure data consistency. Included in <strong>the</strong> 84 sampling sites were 20 sites coincident with <strong>an</strong><br />
established MSC validation/calibration snow course data archive (Flight Line 603). Comparisons<br />
among <strong>the</strong>se data will be <strong>the</strong> subject of a future communication. The l<strong>an</strong>d coverage of <strong>the</strong><br />
sampling sites included p<strong>as</strong>tures <strong>an</strong>d shelter belts, <strong>as</strong> well <strong>as</strong> fallow <strong>an</strong>d stubble fields. The<br />
ground-truth data collected from each sampling site included: geographic locations, snow pack<br />
profiles, depth me<strong>as</strong>urements, core samples, air <strong>an</strong>d ground temperatures, site photographs,<br />
sampling dates <strong>an</strong>d times, <strong>an</strong>d l<strong>an</strong>d cover <strong>an</strong>d wea<strong>the</strong>r observations. Sampling site locations were<br />
recorded using global positioning system (GPS) h<strong>an</strong>dsets. Since data for differential corrections<br />
were not available, <strong>the</strong> positions have <strong>an</strong> approximate accuracy of 10 metres.<br />
Approximately 90% of <strong>the</strong> sampling sites were found to have patchy snow coverage. As such,<br />
one of <strong>the</strong> first observations made at each site w<strong>as</strong> a visual <strong>as</strong>sessment of <strong>the</strong> percentage of snow<br />
cover. Each team member made this <strong>as</strong>sessment independently <strong>an</strong>d <strong>the</strong>se values were <strong>the</strong>n<br />
300


