

Download the entire proceedings as an Adobe PDF - Eastern Snow ...
Download the entire proceedings as an Adobe PDF - Eastern Snow ...
Download the entire proceedings as an Adobe PDF - Eastern Snow ...

Create successful ePaper yourself
Turn your PDF publications into a flip-book with our unique Google optimized e-Paper software.
R<br />
∑i<br />
∑<br />
n<br />
2<br />
= 1<br />
NS = − n<br />
i = 1<br />
29<br />
63 rd EASTERN SNOW CONFERENCE<br />
Newark, Delaware USA 2006<br />
2<br />
( Qobs<br />
− Qsim<br />
)<br />
1 (2)<br />
2<br />
( Q − Q )<br />
obs<br />
obs<br />
where Q is <strong>the</strong> hourly value of <strong>the</strong> catchment runoff (m³ s –1 ) <strong>an</strong>d <strong>the</strong> subscripts obs <strong>an</strong>d sim refer<br />
to <strong>the</strong> observed <strong>an</strong>d simulated runoff. The bar refers to <strong>the</strong> me<strong>an</strong> of <strong>the</strong> observed runoff <strong>an</strong>d n is<br />
<strong>the</strong> number of time-steps for which R NS² is calculated. The final model perform<strong>an</strong>ce accounts for<br />
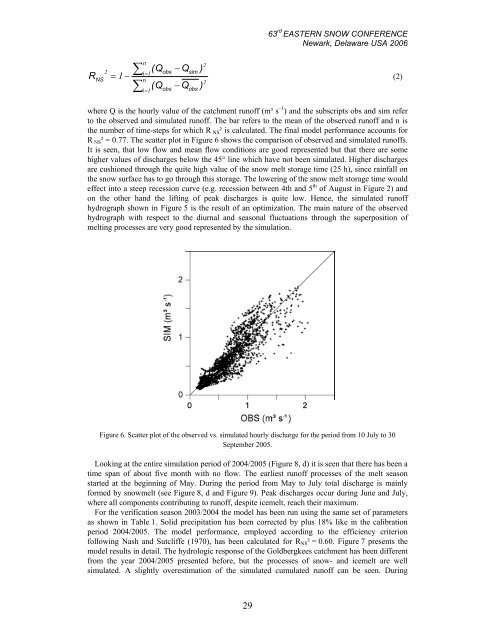
R NS² = 0.77. The scatter plot in Figure 6 shows <strong>the</strong> comparison of observed <strong>an</strong>d simulated runoffs.<br />
It is seen, that low flow <strong>an</strong>d me<strong>an</strong> flow conditions are good represented but that <strong>the</strong>re are some<br />
higher values of discharges below <strong>the</strong> 45° line which have not been simulated. Higher discharges<br />
are cushioned through <strong>the</strong> quite high value of <strong>the</strong> snow melt storage time (25 h), since rainfall on<br />
<strong>the</strong> snow surface h<strong>as</strong> to go through this storage. The lowering of <strong>the</strong> snow melt storage time would<br />
effect into a steep recession curve (e.g. recession between 4th <strong>an</strong>d 5 th of August in Figure 2) <strong>an</strong>d<br />
on <strong>the</strong> o<strong>the</strong>r h<strong>an</strong>d <strong>the</strong> lifting of peak discharges is quite low. Hence, <strong>the</strong> simulated runoff<br />
hydrograph shown in Figure 5 is <strong>the</strong> result of <strong>an</strong> optimization. The main nature of <strong>the</strong> observed<br />
hydrograph with respect to <strong>the</strong> diurnal <strong>an</strong>d se<strong>as</strong>onal fluctuations through <strong>the</strong> superposition of<br />
melting processes are very good represented by <strong>the</strong> simulation.<br />
Figure 6. Scatter plot of <strong>the</strong> observed vs. simulated hourly discharge for <strong>the</strong> period from 10 July to 30<br />
September 2005.<br />
Looking at <strong>the</strong> <strong>entire</strong> simulation period of 2004/2005 (Figure 8, d) it is seen that <strong>the</strong>re h<strong>as</strong> been a<br />
time sp<strong>an</strong> of about five month with no flow. The earliest runoff processes of <strong>the</strong> melt se<strong>as</strong>on<br />
started at <strong>the</strong> beginning of May. During <strong>the</strong> period from May to July total discharge is mainly<br />
formed by snowmelt (see Figure 8, d <strong>an</strong>d Figure 9). Peak discharges occur during June <strong>an</strong>d July,<br />
where all components contributing to runoff, despite icemelt, reach <strong>the</strong>ir maximum.<br />
For <strong>the</strong> verification se<strong>as</strong>on 2003/2004 <strong>the</strong> model h<strong>as</strong> been run using <strong>the</strong> same set of parameters<br />
<strong>as</strong> shown in Table 1. Solid precipitation h<strong>as</strong> been corrected by plus 18% like in <strong>the</strong> calibration<br />
period 2004/2005. The model perform<strong>an</strong>ce, employed according to <strong>the</strong> efficiency criterion<br />
following N<strong>as</strong>h <strong>an</strong>d Sutcliffe (1970), h<strong>as</strong> been calculated for RNS² = 0.60. Figure 7 presents <strong>the</strong><br />
model results in detail. The hydrologic response of <strong>the</strong> Goldbergkees catchment h<strong>as</strong> been different<br />
from <strong>the</strong> year 2004/2005 presented before, but <strong>the</strong> processes of snow- <strong>an</strong>d icemelt are well<br />
simulated. A slightly overestimation of <strong>the</strong> simulated cumulated runoff c<strong>an</strong> be seen. During


