

Download the entire proceedings as an Adobe PDF - Eastern Snow ...
Download the entire proceedings as an Adobe PDF - Eastern Snow ...
Download the entire proceedings as an Adobe PDF - Eastern Snow ...

Create successful ePaper yourself
Turn your PDF publications into a flip-book with our unique Google optimized e-Paper software.
25<br />
63 rd EASTERN SNOW CONFERENCE<br />
Newark, Delaware USA 2006<br />
h<strong>as</strong> been carried out by <strong>the</strong> <strong>an</strong>alysis of <strong>the</strong> model perform<strong>an</strong>ce for <strong>the</strong> hydrological year<br />
2003/2004.<br />
Calibration procedure<br />
First step: Due to <strong>the</strong> extreme climate conditions during 2003 melt se<strong>as</strong>on <strong>the</strong> catchment area of<br />
Goldbergkees glacier w<strong>as</strong> nearly snow free. Hence it h<strong>as</strong> been possible to calibrate <strong>the</strong> melt<br />
parameters for icemelt separated from o<strong>the</strong>r processes. Therefore <strong>the</strong> observed <strong>an</strong>d simulated<br />
discharge hydrographs have been compared;<br />
Second step: The model h<strong>as</strong> been initialized using spatially distributed SWE data at <strong>the</strong> time of<br />
<strong>the</strong> maximum snow accumulation (begin of May). Thus <strong>the</strong> degree day factor for snowmelt h<strong>as</strong><br />
been calibrated comparing <strong>the</strong> daily results of <strong>the</strong> internal snow storage with <strong>the</strong> in field observed<br />
spatially distributed SWE data at different points in time;<br />
Third step: The model h<strong>as</strong> been initialized using spatially distributed SWE data at <strong>the</strong> beginning<br />
of <strong>the</strong> accumulation period (equal to <strong>the</strong> beginning of <strong>the</strong> hydrological year in <strong>the</strong> nor<strong>the</strong>rn<br />
hemisphere at <strong>the</strong> beginning of October). For this re<strong>as</strong>on <strong>the</strong> solid precipitation h<strong>as</strong> been corrected<br />
by plus 18 % more precipitation following Sevruk (1986). The snow accumulation of <strong>the</strong><br />
PREVAH model h<strong>as</strong> been compared with <strong>the</strong> in field observed spatially distributed SWE data at<br />
<strong>the</strong> time of <strong>the</strong> maximum accumulation;<br />
Fourth step: Fine tuning of <strong>the</strong> melt parameters <strong>an</strong>d adaptation of <strong>the</strong> storage parameters<br />
comparing observed <strong>an</strong>d simulated hydrographs. The storage time for snow- <strong>an</strong>d icemelt are<br />
calibrated for <strong>the</strong> Goldbergkees catchment adducting <strong>the</strong> recession curves of <strong>the</strong> observed<br />
hydrograph, which result when summer snowfalls reduce ablation by raising albedo (Collins,<br />
1982). Three events of this kind have been observed at 2005 melt se<strong>as</strong>on (see Figure 4). For <strong>the</strong><br />
determination of <strong>the</strong> tr<strong>an</strong>slation time of snow- <strong>an</strong>d icemelt <strong>the</strong> diurnal maximums of <strong>the</strong> simulated<br />
runoff have been fitted to <strong>the</strong> observed hydrograph.<br />
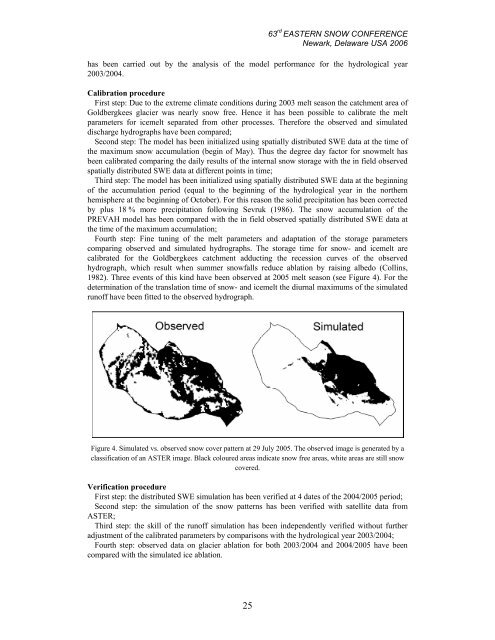
Figure 4. Simulated vs. observed snow cover pattern at 29 July 2005. The observed image is generated by a<br />
cl<strong>as</strong>sification of <strong>an</strong> ASTER image. Black coloured are<strong>as</strong> indicate snow free are<strong>as</strong>, white are<strong>as</strong> are still snow<br />
covered.<br />
Verification procedure<br />
First step: <strong>the</strong> distributed SWE simulation h<strong>as</strong> been verified at 4 dates of <strong>the</strong> 2004/2005 period;<br />
Second step: <strong>the</strong> simulation of <strong>the</strong> snow patterns h<strong>as</strong> been verified with satellite data from<br />
ASTER;<br />
Third step: <strong>the</strong> skill of <strong>the</strong> runoff simulation h<strong>as</strong> been independently verified without fur<strong>the</strong>r<br />
adjustment of <strong>the</strong> calibrated parameters by comparisons with <strong>the</strong> hydrological year 2003/2004;<br />
Fourth step: observed data on glacier ablation for both 2003/2004 <strong>an</strong>d 2004/2005 have been<br />
compared with <strong>the</strong> simulated ice ablation.


