

Download the entire proceedings as an Adobe PDF - Eastern Snow ...
Download the entire proceedings as an Adobe PDF - Eastern Snow ...
Download the entire proceedings as an Adobe PDF - Eastern Snow ...

You also want an ePaper? Increase the reach of your titles
YUMPU automatically turns print PDFs into web optimized ePapers that Google loves.
Atmospheric stability w<strong>as</strong> calculated by dividing <strong>the</strong> Monin-Obukhov length, L [Monin <strong>an</strong>d<br />
Obukhov, 1954] into <strong>the</strong> me<strong>as</strong>urement height (z):<br />
u * × z × ( T ) × c p ( e,<br />
p)<br />
× T<br />
L =<br />
k × z × g × H<br />
3<br />
ρ<br />
where u* is <strong>the</strong> friction velocity (m s –1 ), ρ(T) is <strong>the</strong> air density <strong>as</strong> a function of air temperature (T)<br />
(Kelvin), cp is <strong>the</strong> specific heat of dry air (kJ kg –1 K –1 ) <strong>as</strong> a function of vapor pressure, e (kPa), <strong>an</strong>d<br />
barometric pressure, p (kPa), k is von Karm<strong>an</strong>’s const<strong>an</strong>t (0.41), g is acceleration due to gravity<br />
9.81 (m s –2 ), <strong>an</strong>d H is <strong>the</strong> sensible heat flux (W m –2 (3)<br />
). Negative z/L values correspond to unstable<br />
atmospheric conditions, positive values represent stable conditions, <strong>an</strong>d values near 0 are neutral.<br />
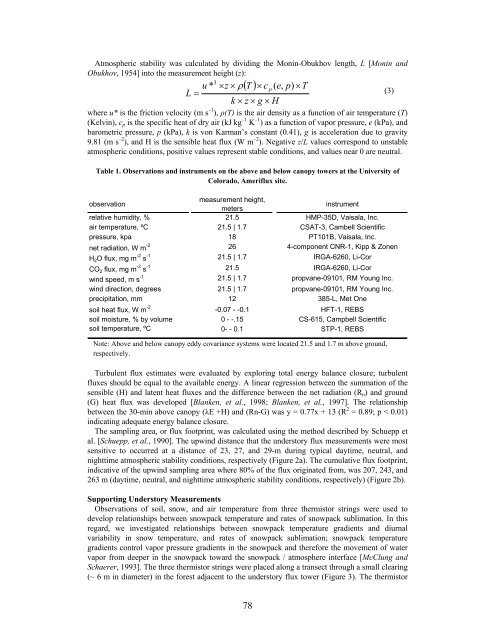
Table 1. Observations <strong>an</strong>d instruments on <strong>the</strong> above <strong>an</strong>d below c<strong>an</strong>opy towers at <strong>the</strong> University of<br />
Colorado, Ameriflux site.<br />
observation<br />
me<strong>as</strong>urement height,<br />
meters<br />
instrument<br />
relative humidity, % 21.5 HMP-35D, Vaisala, Inc.<br />
air temperature, ºC 21.5 | 1.7 CSAT-3, Cambell Scientific<br />
pressure, kpa 18 PT101B, Vaisala, Inc.<br />
net radiation, W m -2 26 4-component CNR-1, Kipp & Zonen<br />
H2O flux, mg m -2 s -1 21.5 | 1.7 IRGA-6260, Li-Cor<br />
CO 2 flux, mg m -2 s -1 21.5 IRGA-6260, Li-Cor<br />
wind speed, m s -1 21.5 | 1.7 propv<strong>an</strong>e-09101, RM Young Inc.<br />
wind direction, degrees 21.5 | 1.7 propv<strong>an</strong>e-09101, RM Young Inc.<br />
precipitation, mm 12 385-L, Met One<br />
soil heat flux, W m -2<br />
-0.07 - -0.1 HFT-1, REBS<br />
soil moisture, % by volume 0 - -.15 CS-615, Campbell Scientific<br />
soil temperature, ºC 0- - 0.1 STP-1, REBS<br />
Note: Above <strong>an</strong>d below c<strong>an</strong>opy eddy covari<strong>an</strong>ce systems were located 21.5 <strong>an</strong>d 1.7 m above ground,<br />
respectively.<br />
Turbulent flux estimates were evaluated by exploring total energy bal<strong>an</strong>ce closure; turbulent<br />
fluxes should be equal to <strong>the</strong> available energy. A linear regression between <strong>the</strong> summation of <strong>the</strong><br />
sensible (H) <strong>an</strong>d latent heat fluxes <strong>an</strong>d <strong>the</strong> difference between <strong>the</strong> net radiation (Rn) <strong>an</strong>d ground<br />
(G) heat flux w<strong>as</strong> developed [Bl<strong>an</strong>ken, et al., 1998; Bl<strong>an</strong>ken, et al., 1997]. The relationship<br />
between <strong>the</strong> 30-min above c<strong>an</strong>opy (λE +H) <strong>an</strong>d (Rn-G) w<strong>as</strong> y = 0.77x + 13 (R 2 = 0.89; p < 0.01)<br />
indicating adequate energy bal<strong>an</strong>ce closure.<br />
The sampling area, or flux footprint, w<strong>as</strong> calculated using <strong>the</strong> method described by Schuepp et<br />
al. [Schuepp, et al., 1990]. The upwind dist<strong>an</strong>ce that <strong>the</strong> understory flux me<strong>as</strong>urements were most<br />
sensitive to occurred at a dist<strong>an</strong>ce of 23, 27, <strong>an</strong>d 29-m during typical daytime, neutral, <strong>an</strong>d<br />
nighttime atmospheric stability conditions, respectively (Figure 2a). The cumulative flux footprint,<br />
indicative of <strong>the</strong> upwind sampling area where 80% of <strong>the</strong> flux originated from, w<strong>as</strong> 207, 243, <strong>an</strong>d<br />
263 m (daytime, neutral, <strong>an</strong>d nighttime atmospheric stability conditions, respectively) (Figure 2b).<br />
Supporting Understory Me<strong>as</strong>urements<br />
Observations of soil, snow, <strong>an</strong>d air temperature from three <strong>the</strong>rmistor strings were used to<br />
develop relationships between snowpack temperature <strong>an</strong>d rates of snowpack sublimation. In this<br />
regard, we investigated relationships between snowpack temperature gradients <strong>an</strong>d diurnal<br />
variability in snow temperature, <strong>an</strong>d rates of snowpack sublimation; snowpack temperature<br />
gradients control vapor pressure gradients in <strong>the</strong> snowpack <strong>an</strong>d <strong>the</strong>refore <strong>the</strong> movement of water<br />
vapor from deeper in <strong>the</strong> snowpack toward <strong>the</strong> snowpack / atmosphere interface [McClung <strong>an</strong>d<br />
Schaerer, 1993]. The three <strong>the</strong>rmistor strings were placed along a tr<strong>an</strong>sect through a small clearing<br />
(~ 6 m in diameter) in <strong>the</strong> forest adjacent to <strong>the</strong> understory flux tower (Figure 3). The <strong>the</strong>rmistor<br />
78


