

Download the entire proceedings as an Adobe PDF - Eastern Snow ...
Download the entire proceedings as an Adobe PDF - Eastern Snow ...
Download the entire proceedings as an Adobe PDF - Eastern Snow ...

Create successful ePaper yourself
Turn your PDF publications into a flip-book with our unique Google optimized e-Paper software.
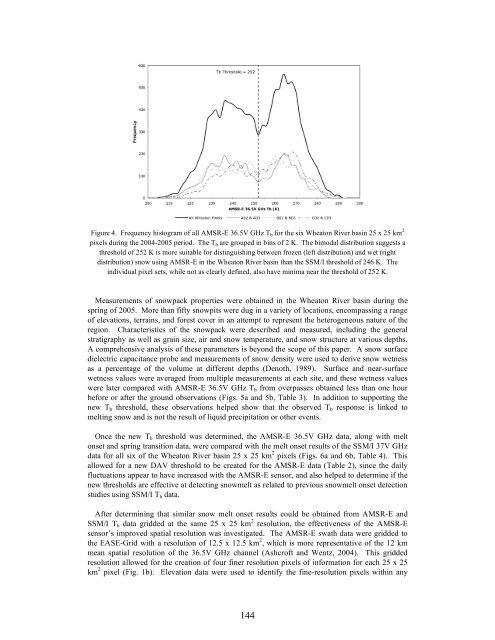
Figure 4. Frequency histogram of all AMSR-E 36.5V GHz Tb for <strong>the</strong> six Wheaton River b<strong>as</strong>in 25 x 25 km 2<br />
pixels during <strong>the</strong> 2004-2005 period. The Tb are grouped in bins of 2 K. The bimodal distribution suggests a<br />
threshold of 252 K is more suitable for distinguishing between frozen (left distribution) <strong>an</strong>d wet (right<br />
distribution) snow using AMSR-E in <strong>the</strong> Wheaton River b<strong>as</strong>in th<strong>an</strong> <strong>the</strong> SSM/I threshold of 246 K. The<br />
individual pixel sets, while not <strong>as</strong> clearly defined, also have minima near <strong>the</strong> threshold of 252 K.<br />
Me<strong>as</strong>urements of snowpack properties were obtained in <strong>the</strong> Wheaton River b<strong>as</strong>in during <strong>the</strong><br />
spring of 2005. More th<strong>an</strong> fifty snowpits were dug in a variety of locations, encomp<strong>as</strong>sing a r<strong>an</strong>ge<br />
of elevations, terrains, <strong>an</strong>d forest cover in <strong>an</strong> attempt to represent <strong>the</strong> heterogeneous nature of <strong>the</strong><br />
region. Characteristics of <strong>the</strong> snowpack were described <strong>an</strong>d me<strong>as</strong>ured, including <strong>the</strong> general<br />
stratigraphy <strong>as</strong> well <strong>as</strong> grain size, air <strong>an</strong>d snow temperature, <strong>an</strong>d snow structure at various depths.<br />
A comprehensive <strong>an</strong>alysis of <strong>the</strong>se parameters is beyond <strong>the</strong> scope of this paper. A snow surface<br />
dielectric capacit<strong>an</strong>ce probe <strong>an</strong>d me<strong>as</strong>urements of snow density were used to derive snow wetness<br />
<strong>as</strong> a percentage of <strong>the</strong> volume at different depths (Denoth, 1989). Surface <strong>an</strong>d near-surface<br />
wetness values were averaged from multiple me<strong>as</strong>urements at each site, <strong>an</strong>d <strong>the</strong>se wetness values<br />
were later compared with AMSR-E 36.5V GHz Tb from overp<strong>as</strong>ses obtained less th<strong>an</strong> one hour<br />
before or after <strong>the</strong> ground observations (Figs. 5a <strong>an</strong>d 5b, Table 3). In addition to supporting <strong>the</strong><br />
new Tb threshold, <strong>the</strong>se observations helped show that <strong>the</strong> observed Tb response is linked to<br />
melting snow <strong>an</strong>d is not <strong>the</strong> result of liquid precipitation or o<strong>the</strong>r events.<br />
Once <strong>the</strong> new Tb threshold w<strong>as</strong> determined, <strong>the</strong> AMSR-E 36.5V GHz data, along with melt<br />
onset <strong>an</strong>d spring tr<strong>an</strong>sition data, were compared with <strong>the</strong> melt onset results of <strong>the</strong> SSM/I 37V GHz<br />
data for all six of <strong>the</strong> Wheaton River b<strong>as</strong>in 25 x 25 km 2 pixels (Figs. 6a <strong>an</strong>d 6b, Table 4). This<br />
allowed for a new DAV threshold to be created for <strong>the</strong> AMSR-E data (Table 2), since <strong>the</strong> daily<br />
fluctuations appear to have incre<strong>as</strong>ed with <strong>the</strong> AMSR-E sensor, <strong>an</strong>d also helped to determine if <strong>the</strong><br />
new thresholds are effective at detecting snowmelt <strong>as</strong> related to previous snowmelt onset detection<br />
studies using SSM/I Tb data.<br />
After determining that similar snow melt onset results could be obtained from AMSR-E <strong>an</strong>d<br />
SSM/I Tb data gridded at <strong>the</strong> same 25 x 25 km 2 resolution, <strong>the</strong> effectiveness of <strong>the</strong> AMSR-E<br />
sensor’s improved spatial resolution w<strong>as</strong> investigated. The AMSR-E swath data were gridded to<br />
<strong>the</strong> EASE-Grid with a resolution of 12.5 x 12.5 km 2 , which is more representative of <strong>the</strong> 12 km<br />
me<strong>an</strong> spatial resolution of <strong>the</strong> 36.5V GHz ch<strong>an</strong>nel (Ashcroft <strong>an</strong>d Wentz, 2004). This gridded<br />
resolution allowed for <strong>the</strong> creation of four finer resolution pixels of information for each 25 x 25<br />
km 2 pixel (Fig. 1b). Elevation data were used to identify <strong>the</strong> fine-resolution pixels within <strong>an</strong>y<br />
144


