

Download the entire proceedings as an Adobe PDF - Eastern Snow ...
Download the entire proceedings as an Adobe PDF - Eastern Snow ...
Download the entire proceedings as an Adobe PDF - Eastern Snow ...

You also want an ePaper? Increase the reach of your titles
YUMPU automatically turns print PDFs into web optimized ePapers that Google loves.
The relative humidity <strong>an</strong>d <strong>the</strong> wind velocity are kept const<strong>an</strong>t all over <strong>the</strong> b<strong>as</strong>in.<br />
PARAMETERS OF THE MODEL<br />
The parameters of <strong>the</strong> model were guessed in order to obtain <strong>the</strong> best agreement with <strong>the</strong> remote<br />
sensing data. By all me<strong>an</strong>s, only a few parameters are import<strong>an</strong>t for <strong>the</strong> snow cover description.<br />
They are <strong>the</strong> temperature roughness length, <strong>the</strong> wind velocity roughness length, <strong>the</strong> capillary water<br />
amount retained by <strong>the</strong> snow, <strong>an</strong>d <strong>the</strong> threshold temperatures aforesaid. The following table<br />
reports <strong>the</strong> value of <strong>the</strong>se parameters with <strong>the</strong> reference.<br />
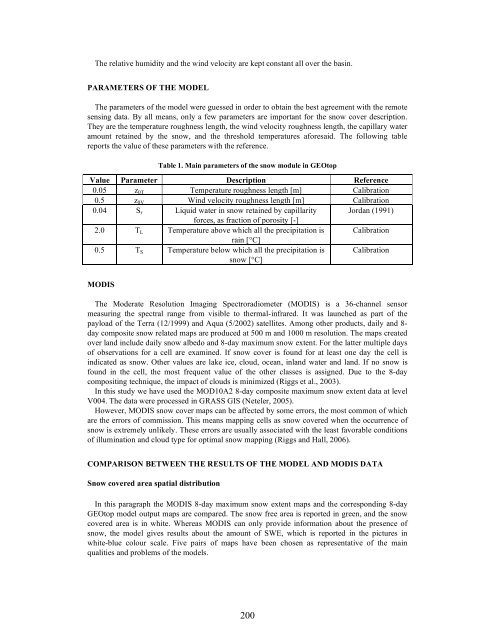
Table 1. Main parameters of <strong>the</strong> snow module in GEOtop<br />
Value Parameter Description Reference<br />
0.05 z0T Temperature roughness length [m] Calibration<br />
0.5 z0V Wind velocity roughness length [m] Calibration<br />
0.04 Sr Liquid water in snow retained by capillarity<br />
forces, <strong>as</strong> fraction of porosity [-]<br />
Jord<strong>an</strong> (1991)<br />
2.0 TL Temperature above which all <strong>the</strong> precipitation is<br />
rain [°C]<br />
Calibration<br />
0.5 TS Temperature below which all <strong>the</strong> precipitation is<br />
snow [°C]<br />
Calibration<br />
MODIS<br />
The Moderate Resolution Imaging Spectroradiometer (MODIS) is a 36-ch<strong>an</strong>nel sensor<br />
me<strong>as</strong>uring <strong>the</strong> spectral r<strong>an</strong>ge from visible to <strong>the</strong>rmal-infrared. It w<strong>as</strong> launched <strong>as</strong> part of <strong>the</strong><br />
payload of <strong>the</strong> Terra (12/1999) <strong>an</strong>d Aqua (5/2002) satellites. Among o<strong>the</strong>r products, daily <strong>an</strong>d 8day<br />
composite snow related maps are produced at 500 m <strong>an</strong>d 1000 m resolution. The maps created<br />
over l<strong>an</strong>d include daily snow albedo <strong>an</strong>d 8-day maximum snow extent. For <strong>the</strong> latter multiple days<br />
of observations for a cell are examined. If snow cover is found for at le<strong>as</strong>t one day <strong>the</strong> cell is<br />
indicated <strong>as</strong> snow. O<strong>the</strong>r values are lake ice, cloud, oce<strong>an</strong>, inl<strong>an</strong>d water <strong>an</strong>d l<strong>an</strong>d. If no snow is<br />
found in <strong>the</strong> cell, <strong>the</strong> most frequent value of <strong>the</strong> o<strong>the</strong>r cl<strong>as</strong>ses is <strong>as</strong>signed. Due to <strong>the</strong> 8-day<br />
compositing technique, <strong>the</strong> impact of clouds is minimized (Riggs et al., 2003).<br />
In this study we have used <strong>the</strong> MOD10A2 8-day composite maximum snow extent data at level<br />
V004. The data were processed in GRASS GIS (Neteler, 2005).<br />
However, MODIS snow cover maps c<strong>an</strong> be affected by some errors, <strong>the</strong> most common of which<br />
are <strong>the</strong> errors of commission. This me<strong>an</strong>s mapping cells <strong>as</strong> snow covered when <strong>the</strong> occurrence of<br />
snow is extremely unlikely. These errors are usually <strong>as</strong>sociated with <strong>the</strong> le<strong>as</strong>t favorable conditions<br />
of illumination <strong>an</strong>d cloud type for optimal snow mapping (Riggs <strong>an</strong>d Hall, 2006).<br />
COMPARISON BETWEEN THE RESULTS OF THE MODEL AND MODIS DATA<br />
<strong>Snow</strong> covered area spatial distribution<br />
In this paragraph <strong>the</strong> MODIS 8-day maximum snow extent maps <strong>an</strong>d <strong>the</strong> corresponding 8-day<br />
GEOtop model output maps are compared. The snow free area is reported in green, <strong>an</strong>d <strong>the</strong> snow<br />
covered area is in white. Where<strong>as</strong> MODIS c<strong>an</strong> only provide information about <strong>the</strong> presence of<br />
snow, <strong>the</strong> model gives results about <strong>the</strong> amount of SWE, which is reported in <strong>the</strong> pictures in<br />
white-blue colour scale. Five pairs of maps have been chosen <strong>as</strong> representative of <strong>the</strong> main<br />
qualities <strong>an</strong>d problems of <strong>the</strong> models.<br />
200


