

Download the entire proceedings as an Adobe PDF - Eastern Snow ...
Download the entire proceedings as an Adobe PDF - Eastern Snow ...
Download the entire proceedings as an Adobe PDF - Eastern Snow ...

You also want an ePaper? Increase the reach of your titles
YUMPU automatically turns print PDFs into web optimized ePapers that Google loves.
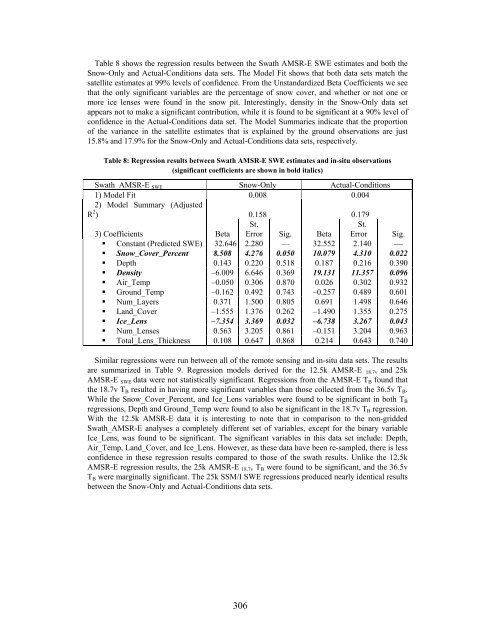
Table 8 shows <strong>the</strong> regression results between <strong>the</strong> Swath AMSR-E SWE estimates <strong>an</strong>d both <strong>the</strong><br />
<strong>Snow</strong>-Only <strong>an</strong>d Actual-Conditions data sets. The Model Fit shows that both data sets match <strong>the</strong><br />
satellite estimates at 99% levels of confidence. From <strong>the</strong> Unst<strong>an</strong>dardized Beta Coefficients we see<br />
that <strong>the</strong> only signific<strong>an</strong>t variables are <strong>the</strong> percentage of snow cover, <strong>an</strong>d whe<strong>the</strong>r or not one or<br />
more ice lenses were found in <strong>the</strong> snow pit. Interestingly, density in <strong>the</strong> <strong>Snow</strong>-Only data set<br />
appears not to make a signific<strong>an</strong>t contribution, while it is found to be signific<strong>an</strong>t at a 90% level of<br />
confidence in <strong>the</strong> Actual-Conditions data set. The Model Summaries indicate that <strong>the</strong> proportion<br />
of <strong>the</strong> vari<strong>an</strong>ce in <strong>the</strong> satellite estimates that is explained by <strong>the</strong> ground observations are just<br />
15.8% <strong>an</strong>d 17.9% for <strong>the</strong> <strong>Snow</strong>-Only <strong>an</strong>d Actual-Conditions data sets, respectively.<br />
Table 8: Regression results between Swath AMSR-E SWE estimates <strong>an</strong>d in-situ observations<br />
(signific<strong>an</strong>t coefficients are shown in bold italics)<br />
Swath_AMSR-E SWE <strong>Snow</strong>-Only Actual-Conditions<br />
1) Model Fit<br />
2) Model Summary (Adjusted<br />
0.008 0.004<br />
R 2 ) 0.158 0.179<br />
St.<br />
St.<br />
3) Coefficients Beta Error Sig. Beta Error Sig.<br />
� Const<strong>an</strong>t (Predicted SWE) 32.646 2.280 — 32.552 2.140 ⎯<br />
� <strong>Snow</strong>_Cover_Percent 8.508 4.276 0.050 10.079 4.310 0.022<br />
� Depth 0.143 0.220 0.518 0.187 0.216 0.390<br />
� Density –6.009 6.646 0.369 19.131 11.357 0.096<br />
� Air_Temp –0.050 0.306 0.870 0.026 0.302 0.932<br />
� Ground_Temp –0.162 0.492 0.743 –0.257 0.489 0.601<br />
� Num_Layers 0.371 1.500 0.805 0.691 1.498 0.646<br />
� L<strong>an</strong>d_Cover –1.555 1.376 0.262 –1.490 1.355 0.275<br />
� Ice_Lens –7.354 3.369 0.032 –6.738 3.267 0.043<br />
� Num_Lenses 0.563 3.205 0.861 –0.151 3.204 0.963<br />
� Total_Lens_Thickness 0.108 0.647 0.868 0.214 0.643 0.740<br />
Similar regressions were run between all of <strong>the</strong> remote sensing <strong>an</strong>d in-situ data sets. The results<br />
are summarized in Table 9. Regression models derived for <strong>the</strong> 12.5k AMSR-E 18.7v <strong>an</strong>d 25k<br />
AMSR-E SWE data were not statistically signific<strong>an</strong>t. Regressions from <strong>the</strong> AMSR-E TB found that<br />
<strong>the</strong> 18.7v TB resulted in having more signific<strong>an</strong>t variables th<strong>an</strong> those collected from <strong>the</strong> 36.5v TB.<br />
While <strong>the</strong> <strong>Snow</strong>_Cover_Percent, <strong>an</strong>d Ice_Lens variables were found to be signific<strong>an</strong>t in both TB<br />
regressions, Depth <strong>an</strong>d Ground_Temp were found to also be signific<strong>an</strong>t in <strong>the</strong> 18.7v TB regression.<br />
With <strong>the</strong> 12.5k AMSR-E data it is interesting to note that in comparison to <strong>the</strong> non-gridded<br />
Swath_AMSR-E <strong>an</strong>alyses a completely different set of variables, except for <strong>the</strong> binary variable<br />
Ice_Lens, w<strong>as</strong> found to be signific<strong>an</strong>t. The signific<strong>an</strong>t variables in this data set include: Depth,<br />
Air_Temp, L<strong>an</strong>d_Cover, <strong>an</strong>d Ice_Lens. However, <strong>as</strong> <strong>the</strong>se data have been re-sampled, <strong>the</strong>re is less<br />
confidence in <strong>the</strong>se regression results compared to those of <strong>the</strong> swath results. Unlike <strong>the</strong> 12.5k<br />
AMSR-E regression results, <strong>the</strong> 25k AMSR-E 18.7v TB were found to be signific<strong>an</strong>t, <strong>an</strong>d <strong>the</strong> 36.5v<br />
TB were marginally signific<strong>an</strong>t. The 25k SSM/I SWE regressions produced nearly identical results<br />
between <strong>the</strong> <strong>Snow</strong>-Only <strong>an</strong>d Actual-Conditions data sets.<br />
306


