

Download the entire proceedings as an Adobe PDF - Eastern Snow ...
Download the entire proceedings as an Adobe PDF - Eastern Snow ...
Download the entire proceedings as an Adobe PDF - Eastern Snow ...

You also want an ePaper? Increase the reach of your titles
YUMPU automatically turns print PDFs into web optimized ePapers that Google loves.
The third pair (Figure 5) represents <strong>the</strong> snow cover after a snowfall in winter. It is difficult for<br />
<strong>the</strong> model to reproduce <strong>the</strong> snow in <strong>the</strong> bottom of <strong>the</strong> valley, <strong>as</strong> <strong>the</strong> air temperature field c<strong>an</strong> be<br />
uneven <strong>an</strong>d snow precipitation occurs usually at low elevations when <strong>the</strong> air temperature is close<br />
or even slightly above 0 °C. For this re<strong>as</strong>on <strong>the</strong> threshold temperature above which <strong>the</strong><br />
precipitation is always liquid <strong>an</strong>d <strong>the</strong> threshold temperature below which <strong>the</strong> precipitation is<br />
always solid have been fixed to 2 °C <strong>an</strong>d 0.5 °C, respectively, after some calibrations. These values<br />
are a little different from <strong>the</strong> values proposed in US Army Corps of Engineers (1956), respectively<br />
3 °C <strong>an</strong>d -1 °C. The are<strong>as</strong> located at <strong>the</strong> bottom valley are quite large, but <strong>the</strong>y are usually covered<br />
by a small amount of snow, which melts quickly.<br />
The fourth pair (Figure 6) is relative to early springtime. The snow patterns are dominated by<br />
elevation, <strong>as</strong> a consequence of late snowfall events, <strong>as</strong> well <strong>as</strong> by slope <strong>an</strong>d <strong>as</strong>pect, <strong>as</strong> it is possible<br />
to appreciate <strong>the</strong> differential melting in north facing <strong>an</strong>d south spacing slopes, even though in <strong>the</strong><br />
two maps <strong>the</strong> snow limit c<strong>an</strong> be slightly different. In this time SWE reaches its maximum value at<br />
<strong>the</strong> highest elevations.<br />
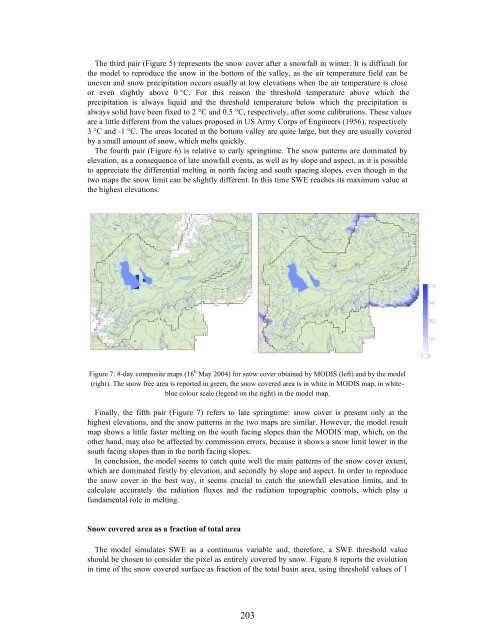
Figure 7: 8-day composite maps (16 h May 2004) for snow cover obtained by MODIS (left) <strong>an</strong>d by <strong>the</strong> model<br />
(right). The snow free area is reported in green, <strong>the</strong> snow covered area is in white in MODIS map, in whiteblue<br />
colour scale (legend on <strong>the</strong> right) in <strong>the</strong> model map.<br />
Finally, <strong>the</strong> fifth pair (Figure 7) refers to late springtime: snow cover is present only at <strong>the</strong><br />
highest elevations, <strong>an</strong>d <strong>the</strong> snow patterns in <strong>the</strong> two maps are similar. However, <strong>the</strong> model result<br />
map shows a little f<strong>as</strong>ter melting on <strong>the</strong> south facing slopes th<strong>an</strong> <strong>the</strong> MODIS map, which, on <strong>the</strong><br />
o<strong>the</strong>r h<strong>an</strong>d, may also be affected by commission errors, because it shows a snow limit lower in <strong>the</strong><br />
south facing slopes th<strong>an</strong> in <strong>the</strong> north facing slopes.<br />
In conclusion, <strong>the</strong> model seems to catch quite well <strong>the</strong> main patterns of <strong>the</strong> snow cover extent,<br />
which are dominated firstly by elevation, <strong>an</strong>d secondly by slope <strong>an</strong>d <strong>as</strong>pect. In order to reproduce<br />
<strong>the</strong> snow cover in <strong>the</strong> best way, it seems crucial to catch <strong>the</strong> snowfall elevation limits, <strong>an</strong>d to<br />
calculate accurately <strong>the</strong> radiation fluxes <strong>an</strong>d <strong>the</strong> radiation topographic controls, which play a<br />
fundamental role in melting.<br />
<strong>Snow</strong> covered area <strong>as</strong> a fraction of total area<br />
The model simulates SWE <strong>as</strong> a continuous variable <strong>an</strong>d, <strong>the</strong>refore, a SWE threshold value<br />
should be chosen to consider <strong>the</strong> pixel <strong>as</strong> <strong>entire</strong>ly covered by snow. Figure 8 reports <strong>the</strong> evolution<br />
in time of <strong>the</strong> snow covered surface <strong>as</strong> fraction of <strong>the</strong> total b<strong>as</strong>in area, using threshold values of 1<br />
203


