Informe semestral (pdf) - Cajastur
Informe semestral (pdf) - Cajastur
Informe semestral (pdf) - Cajastur

You also want an ePaper? Increase the reach of your titles
YUMPU automatically turns print PDFs into web optimized ePapers that Google loves.
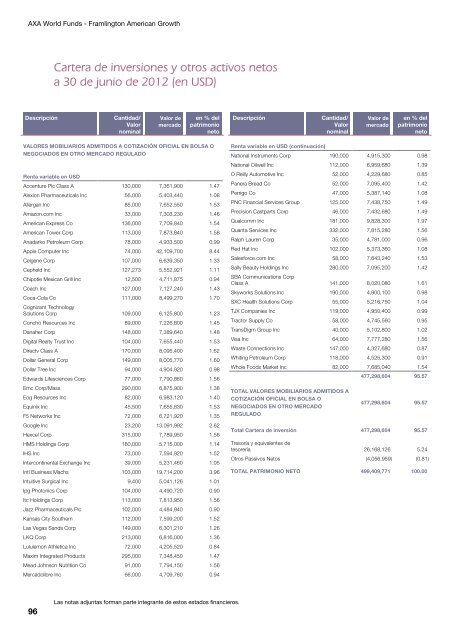
AXA World Funds - Framlington American GrowthCartera de inversiones y otros activos netosa 30 de junio de 2012 (en USD)DescripciónCantidad/ValornominalValor demercadoen % delpatrimonionetoDescripciónCantidad/ValornominalValor demercadoen % delpatrimonionetoVALORES MOBILIARIOS ADMITIDOS A COTIZACIÓN OFICIAL EN BOLSA ONEGOCIADOS EN OTRO MERCADO REGULADORenta variable en USDAccenture Plc Class A 130,000 7,361,900 1.47Alexion Pharmaceuticals Inc 56,000 5,403,440 1.08Allergan Inc 85,000 7,652,550 1.53Amazon.com Inc 33,000 7,303,230 1.46American Express Co 136,000 7,709,840 1.54American Tower Corp 113,000 7,873,840 1.58Anadarko Petroleum Corp 78,000 4,933,500 0.99Apple Computer Inc 74,000 42,109,700 8.44Celgene Corp 107,000 6,639,350 1.33Cepheid Inc 127,273 5,552,921 1.11Chipotle Mexican Grill Inc 12,500 4,711,875 0.94Coach Inc 127,000 7,127,240 1.43Coca-Cola Co 111,000 8,499,270 1.70Cognizant TechnologySolutions Corp 109,000 6,125,800 1.23Concho Resources Inc 89,000 7,226,800 1.45Danaher Corp 148,000 7,389,640 1.48Digital Realty Trust Inc 104,000 7,655,440 1.53Directv Class A 170,000 8,095,400 1.62Dollar General Corp 149,000 8,005,770 1.60Dollar Tree Inc 94,000 4,904,920 0.98Edwards Lifesciences Corp 77,000 7,790,860 1.56Emc Corp/Mass 290,000 6,875,900 1.38Eog Resources Inc 82,000 6,983,120 1.40Equinix Inc 45,500 7,655,830 1.53F5 Networks Inc 72,000 6,721,920 1.35Google Inc 23,200 13,091,992 2.62Hexcel Corp 315,000 7,789,950 1.56HMS Holdings Corp 180,000 5,715,000 1.14IHS Inc 73,000 7,594,920 1.52Intercontinental Exchange Inc 39,000 5,231,460 1.05Intl Business Machs 103,000 19,714,200 3.96Intuitive Surgical Inc 9,400 5,041,126 1.01Ipg Photonics Corp 104,000 4,490,720 0.90Itc Holdings Corp 113,000 7,813,950 1.56Jazz Pharmaceuticals Plc 102,000 4,484,940 0.90Kansas City Southern 112,000 7,599,200 1.52Las Vegas Sands Corp 149,000 6,301,210 1.26LKQ Corp 213,000 6,816,000 1.36Lululemon Athletica Inc 72,000 4,205,520 0.84Maxim Integrated Products 295,000 7,348,450 1.47Mead Johnson Nutrition Co 91,000 7,794,150 1.56Mercadolibre Inc 66,000 4,709,760 0.94Renta variable en USD (continuación)National Instruments Corp 190,000 4,915,300 0.98National Oilwell Inc 112,000 6,959,680 1.39O Reilly Automotive Inc 52,000 4,229,680 0.85Panera Bread Co 52,000 7,095,400 1.42Perrigo Co 47,000 5,387,140 1.08PNC Financial Services Group 125,000 7,438,750 1.49Precision Castparts Corp 46,000 7,432,680 1.49Qualcomm Inc 181,000 9,828,300 1.97Quanta Services Inc 332,000 7,815,280 1.56Ralph Lauren Corp 35,000 4,781,000 0.96Red Hat Inc 102,000 5,373,360 1.08Salesforce.com Inc 58,000 7,643,240 1.53Sally Beauty Holdings Inc 280,000 7,095,200 1.42SBA Communications CorpClass A 141,000 8,020,080 1.61Skyworks Solutions Inc 190,000 4,900,100 0.98SXC Health Solutions Corp 55,000 5,216,750 1.04TJX Companies Inc 119,000 4,950,400 0.99Tractor Supply Co 58,000 4,745,560 0.95TransDigm Group Inc 40,000 5,102,800 1.02Visa Inc 64,000 7,777,280 1.56Waste Connections Inc 147,000 4,327,680 0.87Whiting Petroleum Corp 118,000 4,525,300 0.91Whole Foods Market Inc 82,000 7,685,040 1.54477,298,604 95.57TOTAL VALORES MOBILIARIOS ADMITIDOS ACOTIZACIÓN OFICIAL EN BOLSA ONEGOCIADOS EN OTRO MERCADOREGULADO477,298,604 95.57Total Cartera de inversión 477,298,604 95.57Tresoría y equivalentes detesorería 26,168,126 5.24Otros Passivos Netos (4,056,959) (0.81)TOTAL PATRIMONIO NETO 499,409,771 100.0096Las notas adjuntas forman parte integrante de estos estados financieros.