informe de rendicion de cuentas del sector público de honduras ...
informe de rendicion de cuentas del sector público de honduras ...
informe de rendicion de cuentas del sector público de honduras ...

You also want an ePaper? Increase the reach of your titles
YUMPU automatically turns print PDFs into web optimized ePapers that Google loves.
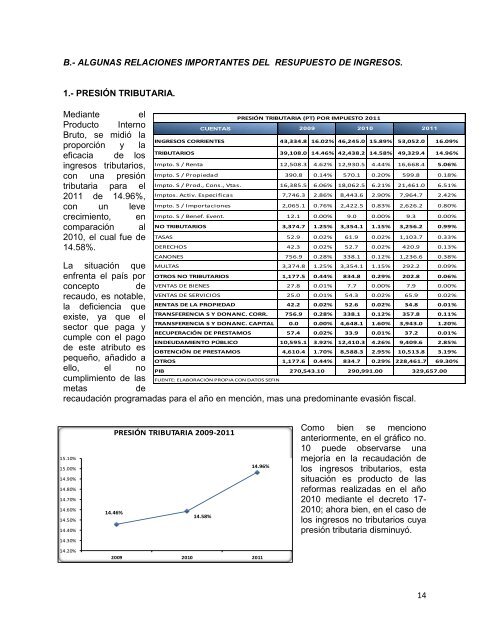
B.- ALGUNAS RELACIONES IMPORTANTES DEL RESUPUESTO DE INGRESOS.<br />
1.- PRESIÓN TRIBUTARIA.<br />
Mediante el<br />
Producto Interno<br />
Bruto, se midió la<br />
proporción y la<br />
eficacia <strong>de</strong> los<br />
ingresos tributarios,<br />
con una presión<br />
tributaria para el<br />
2011 <strong>de</strong> 14.96%,<br />
con un leve<br />
crecimiento, en<br />
comparación al<br />
2010, el cual fue <strong>de</strong><br />
14.58%.<br />
CUENTAS<br />
INGRESOS CORRIENTES 43,334.8 16.02% 46,245.0 15.89% 53,052.0 16.09%<br />
TRIBUTARIOS 39,108.0 14.46% 42,438.2 14.58% 49,329.4 14.96%<br />
Impto. S / Renta 12,508.3 4.62% 12,930.5 4.44% 16,668.4 5.06%<br />
Impto. S / Propiedad 390.8 0.14% 570.1 0.20% 599.8 0.18%<br />
Impto. S / Prod., Cons., Vtas. 16,385.5 6.06% 18,062.5 6.21% 21,461.0 6.51%<br />
Imptos. Activ. Especificas 7,746.3 2.86% 8,443.6 2.90% 7,964.7 2.42%<br />
Impto. S / Importaciones 2,065.1 0.76% 2,422.5 0.83% 2,626.2 0.80%<br />
Impto. S / Benef. Event. 12.1 0.00% 9.0 0.00% 9.3 0.00%<br />
NO TRIBUTARIOS 3,374.7 1.25% 3,354.1 1.15% 3,256.2 0.99%<br />
TASAS 52.9 0.02% 61.9 0.02% 1,103.7 0.33%<br />
DERECHOS 42.3 0.02% 52.7 0.02% 420.9 0.13%<br />
CANONES 756.9 0.28% 338.1 0.12% 1,236.6 0.38%<br />
La situación que<br />
enfrenta el país por<br />
concepto <strong>de</strong><br />
recaudo, es notable,<br />
la <strong>de</strong>ficiencia que<br />
existe, ya que el<br />
<strong>sector</strong> que paga y<br />
cumple con el pago<br />
<strong>de</strong> este atributo es<br />
pequeño, añadido a<br />
ello, el no<br />
cumplimiento <strong>de</strong> las<br />
PIB<br />
FUENTE: ELABORACIÓN PROPIA CON DATOS SEFIN<br />
metas <strong>de</strong><br />
recaudación programadas para el año en mención, mas una predominante evasión fiscal.<br />
15.10%<br />
15.00%<br />
14.90%<br />
14.80%<br />
14.70%<br />
14.60%<br />
14.50%<br />
14.40%<br />
14.30%<br />
14.20%<br />
14.46%<br />
PRESIÓN TRIBUTARIA (PT) POR IMPUESTO 2011<br />
2009 2010 2011<br />
MULTAS 3,374.8 1.25% 3,354.1 1.15% 292.2 0.09%<br />
OTROS NO TRIBUTARIOS 1,177.5 0.44% 834.8 0.29% 202.8 0.06%<br />
VENTAS DE BIENES 27.8 0.01% 7.7 0.00% 7.9 0.00%<br />
VENTAS DE SERVICIOS 25.0 0.01% 54.3 0.02% 65.9 0.02%<br />
RENTAS DE LA PROPIEDAD 42.2 0.02% 52.6 0.02% 34.8 0.01%<br />
TRANSFERENCIA S Y DONANC. CORR. 756.9 0.28% 338.1 0.12% 357.8 0.11%<br />
TRANSFERENCIA S Y DONANC. CAPITAL 0.0 0.00% 4,648.1 1.60% 3,943.0 1.20%<br />
RECUPERACIÓN DE PRESTAMOS 57.4 0.02% 33.9 0.01% 37.2 0.01%<br />
ENDEUDAMIENTO PÚBLICO 10,595.1 3.92% 12,410.3 4.26% 9,409.6 2.85%<br />
OBTENCIÓN DE PRESTAMOS 4,610.4 1.70% 8,588.3 2.95% 10,513.8 3.19%<br />
OTROS 1,177.6 0.44% 834.7 0.29% 228,461.7 69.30%<br />
PRESIÓN TRIBUTARIA 2009-2011<br />
14.58%<br />
14.96%<br />
2009 2010 2011<br />
270,543.10 290,991.00 329,657.00<br />
Como bien se menciono<br />
anteriormente, en el gráfico no.<br />
10 pue<strong>de</strong> observarse una<br />
mejoría en la recaudación <strong>de</strong><br />
los ingresos tributarios, esta<br />
situación es producto <strong>de</strong> las<br />
reformas realizadas en el año<br />
2010 mediante el <strong>de</strong>creto 17-<br />
2010; ahora bien, en el caso <strong>de</strong><br />
los ingresos no tributarios cuya<br />
presión tributaria disminuyó.<br />
14