

VERS UNE MEMOIRE QUANTIQUE AVEC DES IONS PIEGES
VERS UNE MEMOIRE QUANTIQUE AVEC DES IONS PIEGES
VERS UNE MEMOIRE QUANTIQUE AVEC DES IONS PIEGES

Create successful ePaper yourself
Turn your PDF publications into a flip-book with our unique Google optimized e-Paper software.
tel-00430795, version 1 - 9 Nov 2009<br />
120 CHAPITRE 5. CHARGEMENT DU PIÈGE<br />
Photoionisation loading of large Sr + ion clouds with ultrafast pulses. 3<br />
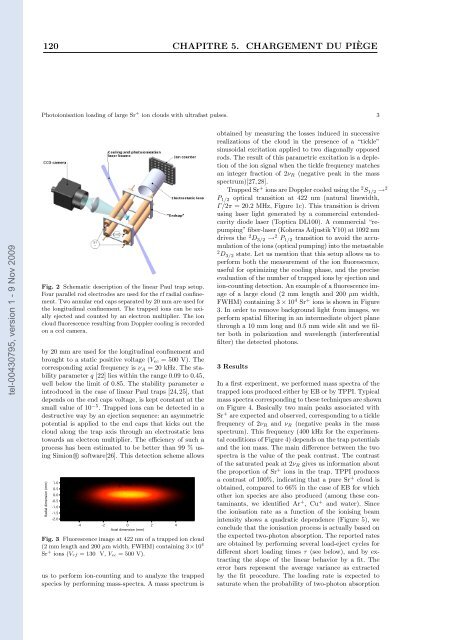
Fig. 2 Schematic description of the linear Paul trap setup.<br />
Four parallel rod electrodes are used for the rf radial confinement.<br />
Two annular end caps separated by 20 mm are used for<br />
the longitudinal confinement. The trapped ions can be axially<br />
ejected and counted by an electron multiplier. The ion<br />
cloud fluorescence resulting from Doppler cooling is recorded<br />
on a ccd camera.<br />
by 20 mm are used for the longitudinal confinement and<br />
brought to a static positive voltage (Vec = 500 V). The<br />
corresponding axial frequency is νA = 20 kHz. The stability<br />
parameter q [22] lies within the range 0.09 to 0.45,<br />
well below the limit of 0.85. The stability parameter a<br />
introduced in the case of linear Paul traps [24,25], that<br />
depends on the end caps voltage, is kept constant at the<br />
small value of 10 −5 . Trapped ions can be detected in a<br />
destructive way by an ejection sequence: an asymmetric<br />
potential is applied to the end caps that kicks out the<br />
cloud along the trap axis through an electrostatic lens<br />
towards an electron multiplier. The efficiency of such a<br />
process has been estimated to be better than 99 % using<br />
Simion R○ software[26]. This detection scheme allows<br />
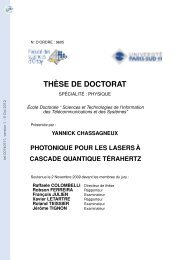
Fig. 3 Fluorescence image at 422 nm of a trapped ion cloud<br />
(2 mm length and 200 µm width, FWHM) containing 3×10 4<br />
Sr + ions (Vrf = 130 V, Vec = 500 V).<br />
us to perform ion-counting and to analyze the trapped<br />
species by performing mass-spectra. A mass spectrum is<br />
obtained by measuring the losses induced in successive<br />
realizations of the cloud in the presence of a “tickle”<br />
sinusoidal excitation applied to two diagonally opposed<br />
rods. The result of this parametric excitation is a depletion<br />
of the ion signal when the tickle frequency matches<br />
an integer fraction of 2νR (negative peak in the mass<br />
spectrum)[27,28].<br />
Trapped Sr + ions are Doppler cooled using the 2 S 1/2 → 2<br />
P 1/2 optical transition at 422 nm (natural linewidth,<br />
Γ/2π = 20.2 MHz, Figure 1c). This transition is driven<br />
using laser light generated by a commercial extendedcavity<br />
diode laser (Toptica DL100). A commercial “repumping”<br />
fiber-laser (Koheras Adjustik Y10) at 1092 nm<br />
drives the 2 D 3/2 → 2 P 1/2 transition to avoid the accumulation<br />
of the ions (optical pumping) into the metastable<br />
2 D3/2 state. Let us mention that this setup allows us to<br />
perform both the measurement of the ion fluorescence,<br />
useful for optimizing the cooling phase, and the precise<br />
evaluation of the number of trapped ions by ejection and<br />
ion-counting detection. An example of a fluorescence image<br />
of a large cloud (2 mm length and 200 µm width,<br />
FWHM) containing 3 × 10 4 Sr + ions is shown in Figure<br />
3. In order to remove background light from images, we<br />
perform spatial filtering in an intermediate object plane<br />
through a 10 mm long and 0.5 mm wide slit and we filter<br />
both in polarization and wavelength (interferential<br />
filter) the detected photons.<br />
3 Results<br />
In a first experiment, we performed mass spectra of the<br />
trapped ions produced either by EB or by TPPI. Typical<br />
mass spectra corresponding to these techniques are shown<br />
on Figure 4. Basically two main peaks associated with<br />
Sr + are expected and observed, corresponding to a tickle<br />
frequency of 2νR and νR (negative peaks in the mass<br />
spectrum). This frequency (400 kHz for the experimental<br />
conditions of Figure 4) depends on the trap potentials<br />
and the ion mass. The main difference between the two<br />
spectra is the value of the peak contrast. The contrast<br />
of the saturated peak at 2νR gives us information about<br />
the proportion of Sr + ions in the trap. TPPI produces<br />
a contrast of 100%, indicating that a pure Sr + cloud is<br />
obtained, compared to 66% in the case of EB for which<br />
other ion species are also produced (among these contaminants,<br />
we identified Ar + , Cu + and water). Since<br />
the ionisation rate as a function of the ionising beam<br />
intensity shows a quadratic dependence (Figure 5), we<br />
conclude that the ionisation process is actually based on<br />
the expected two-photon absorption. The reported rates<br />
are obtained by performing several load-eject cycles for<br />
different short loading times τ (see below), and by extracting<br />
the slope of the linear behavior by a fit. The<br />
error bars represent the average variance as extracted<br />
by the fit procedure. The loading rate is expected to<br />
saturate when the probability of two-photon absorption

![[tel-00433556, v1] Relation entre Stress Oxydant et Homéostasie ...](https://img.yumpu.com/19233319/1/184x260/tel-00433556-v1-relation-entre-stress-oxydant-et-homeostasie-.jpg?quality=85)