le privatizzazioni in italia dal 1992 - Mediobanca Ricerche e Studi ...
le privatizzazioni in italia dal 1992 - Mediobanca Ricerche e Studi ...
le privatizzazioni in italia dal 1992 - Mediobanca Ricerche e Studi ...

Create successful ePaper yourself
Turn your PDF publications into a flip-book with our unique Google optimized e-Paper software.
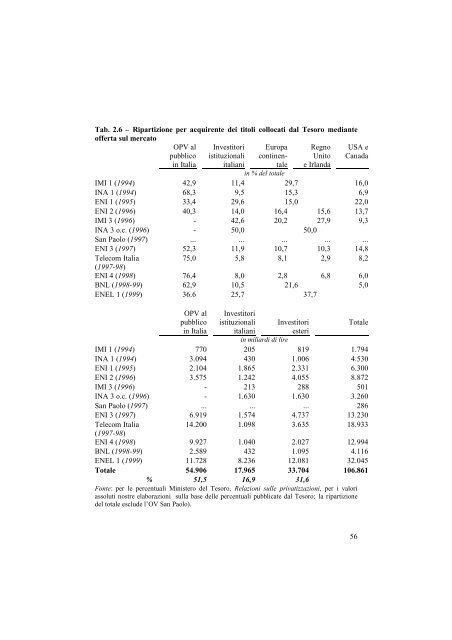
Tab. 2.6 – Ripartizione per acquirente dei titoli collocati <strong>dal</strong> Tesoro mediante<br />
offerta sul mercato<br />
OPV al<br />
pubblico<br />
<strong>in</strong> Italia<br />
Investitori<br />
istituzionali<br />
<strong>italia</strong>ni<br />
Europa<br />
cont<strong>in</strong>enta<strong>le</strong><br />
Regno<br />
Unito<br />
e Irlanda<br />
USA e<br />
Canada<br />
<strong>in</strong> % del tota<strong>le</strong><br />
IMI 1 (1994) 42,9 11,4 29,7 16,0<br />
INA 1 (1994) 68,3 9,5 15,3 6,9<br />
ENI 1 (1995) 33,4 29,6 15,0 22,0<br />
ENI 2 (1996) 40,3 14,0 16,4 15,6 13,7<br />
IMI 3 (1996) - 42,6 20,2 27,9 9,3<br />
INA 3 o.c. (1996) - 50,0 50,0<br />
San Paolo (1997) ... ... ... ... ...<br />
ENI 3 (1997) 52,3 11,9 10,7 10,3 14,8<br />
Te<strong>le</strong>com Italia<br />
75,0 5,8 8,1 2,9 8,2<br />
(1997-98)<br />
ENI 4 (1998) 76,4 8,0 2,8 6,8 6,0<br />
BNL (1998-99) 62,9 10,5 21,6 5,0<br />
ENEL 1 (1999) 36.6 25,7 37,7<br />
OPV al<br />
pubblico<br />
<strong>in</strong> Italia<br />
Investitori<br />
istituzionali<br />
<strong>italia</strong>ni<br />
Investitori Tota<strong>le</strong><br />
esteri<br />
<strong>in</strong> miliardi di lire<br />
IMI 1 (1994) 770 205 819 1.794<br />
INA 1 (1994) 3.094 430 1.006 4.530<br />
ENI 1 (1995) 2.104 1.865 2.331 6.300<br />
ENI 2 (1996) 3.575 1.242 4.055 8.872<br />
IMI 3 (1996) - 213 288 501<br />
INA 3 o.c. (1996) - 1.630 1.630 3.260<br />
San Paolo (1997) ... ... ... 286<br />
ENI 3 (1997) 6.919 1.574 4.737 13.230<br />
Te<strong>le</strong>com Italia<br />
14.200 1.098 3.635 18.933<br />
(1997-98)<br />
ENI 4 (1998) 9.927 1.040 2.027 12.994<br />
BNL (1998-99) 2.589 432 1.095 4.116<br />
ENEL 1 (1999) 11.728 8.236 12.081 32.045<br />
Tota<strong>le</strong> 54.906 17.965 33.704 106.861<br />
% 51,5 16,9 31,6<br />
Fonte: per <strong>le</strong> percentuali M<strong>in</strong>istero del Tesoro, Relazioni sul<strong>le</strong> <strong>privatizzazioni</strong>, per i valori<br />
assoluti nostre elaborazioni sulla base del<strong>le</strong> percentuali pubblicate <strong>dal</strong> Tesoro; la ripartizione<br />
del tota<strong>le</strong> esclude l’OV San Paolo).<br />
56