- Page 1 and 2:
Galloper Wind Farm Project Environm
- Page 3 and 4:
GALLOPER WIND FARM ENVIRONMENTAL ST
- Page 5 and 6:
September 2011 GALLOPER WIND FARM S
- Page 7 and 8:
September 2011 GALLOPER WIND FARM S
- Page 9 and 10:
2842_LVIA 6 September 2011 GALLOPER
- Page 11 and 12:
2842_LVIA 8 September 2011 GALLOPER
- Page 13 and 14:
2842_LVIA 10 September 2011 GALLOPE
- Page 15 and 16:
2842_LVIA 12 September 2011 GALLOPE
- Page 17 and 18:
2842_LVIA 14 September 2011 GALLOPE
- Page 19 and 20:
2842_LVIA 16 September 2011 GALLOPE
- Page 21 and 22:
2842_LVIA 18 September 2011 GALLOPE
- Page 23 and 24:
2842_LVIA 20 September 2011 GALLOPE
- Page 25 and 26:
2842_LVIA 22 September 2011 GALLOPE
- Page 27 and 28:
2842_LVIA 24 September 2011 GALLOPE
- Page 29 and 30:
2842_LVIA 26 September 2011 GALLOPE
- Page 31 and 32:
2842_LVIA 28 September 2011 GALLOPE
- Page 33 and 34:
2842_LVIA 30 September 2011 GALLOPE
- Page 35 and 36:
2842_LVIA 32 September 2011 GALLOPE
- Page 37 and 38:
2842_LVIA 34 September 2011 GALLOPE
- Page 39 and 40:
2842_LVIA 36 September 2011 GALLOPE
- Page 41 and 42:
2842_LVIA 38 September 2011 GALLOPE
- Page 43 and 44:
2842_LVIA 40 September 2011 GALLOPE
- Page 45 and 46:
2842_LVIA 42 September 2011 GALLOPE
- Page 47 and 48:
2842_LVIA 44 September 2011 GALLOPE
- Page 49 and 50:
2842_LVIA 46 September 2011 GALLOPE
- Page 51 and 52:
2842_LVIA 48 September 2011 GALLOPE
- Page 53 and 54:
2842_LVIA 50 September 2011 GALLOPE
- Page 55 and 56:
2842_LVIA 52 September 2011 GALLOPE
- Page 57 and 58:
2842_LVIA 54 September 2011 GALLOPE
- Page 59 and 60:
2842_LVIA 56 September 2011 GALLOPE
- Page 61 and 62:
2842_LVIA 58 September 2011 GALLOPE
- Page 63 and 64:
2842_LVIA 60 September 2011 GALLOPE
- Page 65 and 66:
2842_LVIA 62 September 2011 GALLOPE
- Page 67 and 68:
2842_LVIA 64 September 2011 GALLOPE
- Page 69 and 70:
2842_LVIA 66 September 2011 GALLOPE
- Page 71 and 72:
2842_LVIA 68 September 2011 GALLOPE
- Page 73 and 74:
2842_LVIA 70 September 2011 GALLOPE
- Page 75 and 76:
2842_LVIA 72 September 2011 GALLOPE
- Page 77 and 78:
2842_LVIA 74 September 2011 GALLOPE
- Page 79 and 80:
2842_LVIA 76 September 2011 GALLOPE
- Page 81 and 82:
2842_LVIA 78 September 2011 GALLOPE
- Page 83 and 84:
2842_LVIA 80 September 2011 GALLOPE
- Page 85 and 86:
2842_LVIA 82 September 2011 GALLOPE
- Page 87 and 88:
2842_LVIA 84 September 2011 GALLOPE
- Page 89 and 90:
2842_LVIA 86 September 2011 GALLOPE
- Page 91 and 92:
2842_LVIA 88 September 2011 GALLOPE
- Page 93 and 94:
2842_LVIA 90 September 2011 GALLOPE
- Page 95 and 96:
2842_LVIA 92 September 2011 GALLOPE
- Page 97 and 98:
2842_LVIA 94 September 2011 GALLOPE
- Page 99 and 100:
2842_LVIA 96 September 2011 GALLOPE
- Page 101 and 102:
2842_LVIA 98 September 2011 GALLOPE
- Page 103 and 104:
2842_LVIA 100 September 2011 GALLOP
- Page 105 and 106:
2842_LVIA 102 September 2011 GALLOP
- Page 107 and 108:
2842_LVIA 104 September 2011 GALLOP
- Page 109 and 110:
2842_LVIA 106 September 2011 GALLOP
- Page 111 and 112:
2842_LVIA 108 September 2011 GALLOP
- Page 113 and 114:
2842_LVIA 110 September 2011 GALLOP
- Page 115 and 116:
2842_LVIA 112 September 2011 GALLOP
- Page 117 and 118:
2842_LVIA 114 September 2011 GALLOP
- Page 119 and 120:
2842_LVIA 116 September 2011 GALLOP
- Page 121 and 122:
2842_LVIA 118 September 2011 GALLOP
- Page 123 and 124:
2842_LVIA 120 September 2011 GALLOP
- Page 125 and 126:
2842_LVIA 122 September 2011 GALLOP
- Page 127 and 128:
2842_LVIA 124 September 2011 GALLOP
- Page 129 and 130:
2842_LVIA 126 September 2011 GALLOP
- Page 131 and 132:
2842_LVIA 128 September 2011 GALLOP
- Page 133 and 134:
2842_LVIA 130 September 2011 GALLOP
- Page 135 and 136:
2842_LVIA 132 September 2011 GALLOP
- Page 137 and 138:
2842_LVIA 134 September 2011 GALLOP
- Page 139 and 140:
2842_LVIA 136 September 2011 GALLOP
- Page 141 and 142:
2842_LVIA 138 September 2011 GALLOP
- Page 143 and 144:
2842_LVIA 140 September 2011 GALLOP
- Page 145 and 146:
2842_LVIA 142 September 2011 GALLOP
- Page 147 and 148:
2842_LVIA 144 September 2011 GALLOP
- Page 149 and 150:
2842_LVIA 146 September 2011 GALLOP
- Page 151 and 152:
2842_LVIA 148 September 2011 GALLOP
- Page 153 and 154:
2842_LVIA 150 September 2011 GALLOP
- Page 155 and 156:
2842_LVIA 152 September 2011 GALLOP
- Page 157 and 158:
2842_LVIA 154 Receptor, sensitivity
- Page 159 and 160: 2842_LVIA 156 Table 5: Effects Summ
- Page 161 and 162: 2842_LVIA 158 Receptor, sensitivity
- Page 163 and 164: 2842_LVIA September 2011 GALLOPER W
- Page 165 and 166: 2842_LVIA September 2011 GALLOPER W
- Page 167 and 168: 2842_LVIA September 2011 GALLOPER W
- Page 169 and 170: 2842_LVIA September 2011 GALLOPER W
- Page 171 and 172: 2842_LVIA September 2011 GALLOPER W
- Page 173 and 174: 2842_LVIA September 2011 GALLOPER W
- Page 175 and 176: 2842_LVIA September 2011 GALLOPER W
- Page 177 and 178: Character Area 82 Suffolk Coast and
- Page 179 and 180: This area also fostered the first c
- Page 181 and 182: several small greens in an attempt
- Page 183 and 184: 1 Ancient Estate Claylands EP/Edit1
- Page 185 and 186: 5 Coastal Dunes and Shingle Ridges
- Page 187 and 188: 6 Coastal Levels EP/Edit1/02.08.10
- Page 189 and 190: 6 Coastal Levels EP/Edit1/02.08.10
- Page 191 and 192: 7 Estate Sandlands EP/Edit1/02.08.1
- Page 193 and 194: 7 Estate Sandlands EP/Edit1/02.08.1
- Page 195 and 196: 7 Guidance Note Estate Sandlands EP
- Page 197 and 198: 7 Guidance Note Estate Sandlands EP
- Page 199 and 200: 7 Guidance Note Estate Sandlands EP
- Page 201 and 202: Management Guidelines 1 Ensure new
- Page 203 and 204: Management Guidelines Sandlings Woo
- Page 205 and 206: Management Guidelines 1 Retain the
- Page 207 and 208: Management Guidelines 1 Do not grub
- Page 209: How to use the Landscape Character
- Page 213 and 214: 2842_LVIA September 2011 GALLOPER W
- Page 215 and 216: Galloper Wind Farm Substation Lands
- Page 217 and 218: 2890_mitigation August 2011 Gallope
- Page 219 and 220: 2890_mitigation 2 August 2011 Gallo
- Page 221 and 222: 2890_mitigation 4 August 2011 Gallo
- Page 223 and 224: 2890_mitigation 6 August 2011 Gallo
- Page 225 and 226: 2890_mitigation 8 August 2011 Gallo
- Page 227 and 228: 2890_mitigation 10 August 2011 Gall
- Page 229 and 230: 2890_mitigation 12 August 2011 Gall
- Page 231 and 232: 2890_mitigation 14 August 2011 Gall
- Page 233 and 234: 2890_mitigation 16 August 2011 Gall
- Page 235 and 236: 2890_mitigation 18 August 2011 Gall
- Page 237 and 238: 2890_mitigation August 2011 Gallope
- Page 239 and 240: 2890_mitigation August 2011 Gallope
- Page 241 and 242: 2890_mitigation August 2011 Gallope
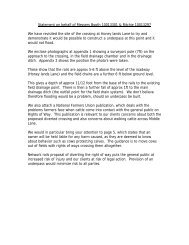
- Page 243 and 244: egion of 16.5m was appropriate on t
- Page 245 and 246: offering to return this to the land
- Page 247 and 248: X:\JOBS\2890 Greater Gabbard - LVIA
- Page 249 and 250: From: Bob.Chamberlain@SuffolkCoasta
- Page 251 and 252: From: Peter.Holborn@suffolk.gov.uk
- Page 253 and 254: From: Rob.Gully@rwe.com To: Colin.M
- Page 255 and 256: Subject: Galloper Wind Farm Landsca
- Page 257 and 258: Path: X:\JOBS\2890 Greater Gabbard
- Page 260 and 261:
2890_mitigation August 2011 Gallope
- Page 262 and 263:
2890_mitigation August 2011 Gallope
- Page 264 and 265:
2842_LVIA September 2011 GALLOPER W
- Page 266 and 267:
2842_LVIA September 2011 GALLOPER W
- Page 268 and 269:
2842_LVIA September 2011 GALLOPER W
- Page 270 and 271:
Path: X:\JOBS\2890 Greater Gabbard
- Page 272 and 273:
Path: X:\JO BS\2890 Greater Gabbard
- Page 274 and 275:
Path: X:\J O BS\2890 Greater Gabbar
- Page 276 and 277:
X/JOBS/2890_Greater Gabbard/6docs/2
- Page 278 and 279:
X/JOBS/2890_Greater Gabbard/6docs/2
- Page 280 and 281:
X/JOBS/2890_Greater Gabbard/6docs/2
- Page 282 and 283:
X/JOBS/2890_Greater Gabbard/6docs/2
- Page 284 and 285:
X/JOBS/2890_Greater Gabbard/6docs/2
- Page 286 and 287:
X/JOBS/2890_Greater Gabbard/6docs/2
- Page 288 and 289:
X/jOBS/2890_Greater Gabbard/6docs/2
- Page 290 and 291:
X/JOBS/2890_Greater Gabbard/6docs/2
- Page 292 and 293:
X/JOBS/2890_Greater Gabbard/6docs/2
- Page 294 and 295:
X/JOBS/2890_Greater Gabbard/6docs/2
- Page 296 and 297:
X/JOBS/2890_Greater Gabbard/6docs/2
- Page 298 and 299:
X/JOBS/2890_Greater Gabbard/6docs/2
- Page 300 and 301:
X/JOBS/2890_Greater Gabbard/6docs/2
- Page 302 and 303:
X/JOBS/2890_Greater Gabbard/6docs/2
- Page 304 and 305:
X/JOBS/2890_Greater Gabbard/6docs/2
- Page 306 and 307:
X/JOBS/2890_Greater Gabbard/6docs/2
- Page 308 and 309:
X/JOBS/2890_Greater Gabbard/6docs/2
- Page 310 and 311:
X/JOBS/2890_Greater Gabbard/6docs/2
- Page 312 and 313:
X/JOBS/2890_Greater Gabbard/6docs/2
- Page 314 and 315:
GALLOPER WIND FARM ENVIRONMENTAL ST
- Page 316 and 317:
2842_SLVIA Contents 1.0 Introductio
- Page 318 and 319:
2842_SLVIA Appendix Appendix 1: Sea
- Page 320 and 321:
2842_SLVIA 1 1.0 Introduction 1.1.1
- Page 322 and 323:
2842_SLVIA 3 The majority of the WT
- Page 324 and 325:
2842_SLVIA 5 2.0 Assessment Methodo
- Page 326 and 327:
2842_SLVIA 7 currently available an
- Page 328 and 329:
2842_SLVIA 9 Table 2: Consultation
- Page 330 and 331:
2842_SLVIA 11 Consultees Date of Co
- Page 332 and 333:
2842_SLVIA 13 3.0 Landscape and Sea
- Page 334 and 335:
2842_SLVIA 15 3.2. Landscape Design
- Page 336 and 337:
2842_SLVIA 17 Suffolk Heritage Coas
- Page 338 and 339:
2842_SLVIA 19 Conservation Areas 3.
- Page 340 and 341:
2842_SLVIA 21 � Coastal Dunes and
- Page 342 and 343:
2842_SLVIA 23 Coastal Levels 4.2.17
- Page 344 and 345:
2842_SLVIA 25 Beyond the ongoing te
- Page 346 and 347:
2842_SLVIA 27 4.2.37. This landscap
- Page 348 and 349:
2842_SLVIA 29 Sensitivity to Change
- Page 350 and 351:
2842_SLVIA 31 seascape and visual e
- Page 352 and 353:
2842_SLVIA 33 dominated by the buil
- Page 354 and 355:
2842_SLVIA 35 visible from within i
- Page 356 and 357:
2842_SLVIA 37 visible from within i
- Page 358 and 359:
2842_SLVIA 39 Extensive, long dista
- Page 360 and 361:
2842_SLVIA 41 Perceptual Qualities
- Page 362 and 363:
2842_SLVIA 43 5.2.4. As can be seen
- Page 364 and 365:
2842_SLVIA 45 River Ore and to east
- Page 366 and 367:
2842_SLVIA 47 5.4.7. It is assumed
- Page 368 and 369:
2842_SLVIA 49 5.8.3. Distances from
- Page 370 and 371:
2842_SLVIA 51 Distance and Directio
- Page 372 and 373:
2842_SLVIA 53 interest within the v
- Page 374 and 375:
2842_SLVIA 55 Viewpoint 5 - Orford
- Page 376 and 377:
2842_SLVIA 57 Existing View 5.8.21.
- Page 378 and 379:
2842_SLVIA 59 5.8.25. The viewpoint
- Page 380 and 381:
2842_SLVIA 61 Table 8: Existing Vie
- Page 382 and 383:
2842_SLVIA 63 main effect. There wi
- Page 384 and 385:
2842_SLVIA 65 Special Landscape Are
- Page 386 and 387:
2842_SLVIA 67 6.3.11. Similarly, fo
- Page 388 and 389:
2842_SLVIA 69 6.4. Operational Effe
- Page 390 and 391:
2842_SLVIA 71 Table 10: Operational
- Page 392 and 393:
2842_SLVIA 73 nature and extent wit
- Page 394 and 395:
2842_SLVIA 75 the proposed WTGs of
- Page 396 and 397:
2842_SLVIA 77 7.3. Representative V
- Page 398 and 399:
2842_SLVIA 79 Magnitude and Signifi
- Page 400 and 401:
2842_SLVIA 81 east-southeast sector
- Page 402 and 403:
2842_SLVIA 83 horizon line by appro
- Page 404 and 405:
2842_SLVIA 85 Viewpoint Viewpoint 5
- Page 406 and 407:
2842_SLVIA 87 Alderton and to Oak H
- Page 408 and 409:
2842_SLVIA 89 structures/embankment
- Page 410 and 411:
2842_SLVIA 91 8.0 Cumulative Effect
- Page 412 and 413:
2842_SLVIA 93 8.4. Cumulative Seasc
- Page 414 and 415:
2842_SLVIA 95 8.5.2. The assessment
- Page 416 and 417:
2842_SLVIA 97 8.5.9. Receptors pass
- Page 418 and 419:
2842_SLVIA 99 8.6. Cumulative Viewp
- Page 420 and 421:
2842_SLVIA 101 effects. There could
- Page 422 and 423:
2842_SLVIA 103 10.0 Summary and Con
- Page 424 and 425:
2842_SLVIA 105 between the proposed
- Page 426 and 427:
2842_SLVIA 107 10.4. Summary of Cum
- Page 428 and 429:
2842_SLVIA Appendix 1: Seascape, La
- Page 430 and 431:
2842_SLVIA � The effects of histo
- Page 432 and 433:
2842_SLVIA � A desk study of nati
- Page 434 and 435:
2842_SLVIA ZTVs and wireframes are
- Page 436 and 437:
2842_SLVIA � High - Total or majo
- Page 438 and 439:
2842_SLVIA Making positive/adverse
- Page 440 and 441:
2842_SLVIA how each of the key char
- Page 442 and 443:
2842_SLVIA fact that they are in a
- Page 444 and 445:
2842_SLVIA The cumulative assessmen
- Page 446 and 447:
2842_SLVIA Appendix 2: Regional Lan
- Page 448 and 449:
5 Coastal Dunes and Shingle Ridges
- Page 450 and 451:
5 Coastal Dunes and Shingle Ridges
- Page 452 and 453:
6 Coastal Levels EP/Edit1/02.08.10
- Page 454 and 455:
6 Coastal Levels EP/Edit1/1.10.10 C
- Page 456 and 457:
6 Coastal Levels EP/Edit1/1.10.10 t
- Page 458 and 459:
7 Estate Sandlands EP/Edit1/02.08.1
- Page 460 and 461:
7 Estate Sandlands EP/Edit1/02.08.1
- Page 462 and 463:
7 Guidance Note Estate Sandlands EP
- Page 464 and 465:
7 Guidance Note Estate Sandlands EP
- Page 466 and 467:
7 Guidance Note Estate Sandlands EP
- Page 468 and 469:
16 Guidance Note Rolling Estate San
- Page 470 and 471:
16 Guidance Note Rolling Estate San
- Page 472 and 473:
16 Rolling Estate Sandlands EP/Edit
- Page 474 and 475:
2842_SLVIA Appendix 3: Methodology
- Page 476 and 477:
2842_SLVIA viewpoint is then genera
- Page 478 and 479:
2842_SLVIA Appendix 4: Source Docum
- Page 480 and 481:
2842_SLVIA Landscape capacity refer