Vegetation Classification and Mapping Project Report - USGS
Vegetation Classification and Mapping Project Report - USGS
Vegetation Classification and Mapping Project Report - USGS

Create successful ePaper yourself
Turn your PDF publications into a flip-book with our unique Google optimized e-Paper software.
<strong>USGS</strong>-NPS <strong>Vegetation</strong> <strong>Mapping</strong> Program<br />
Colonial National Historical Park<br />
across the l<strong>and</strong>scape <strong>and</strong> thus the errors of omission could be high. However, since polygons<br />
were surveyed completely on-the-ground there is a high probability that they are mapped<br />
correctly <strong>and</strong> comission errors would be low. Three map classes were created to indicate<br />
vegetation that may have formerly represented natural communities, but is now too altered to<br />
assign to a natural community classification. The polygons in these classes were mapped only<br />
due to chance encounters, were surveyed completely during the mapping phase of the project,<br />
<strong>and</strong> thus were excluded from the accuracy assessment: Disturbed Calcareous Forest, Disturbed<br />
Depressional Wetl<strong>and</strong>, Disturbed Seepage Swamp. Table 7 summarizes the thematic accuracy<br />
assessment sampling strategy, showing the allocation of the 183 accuracy assessment points<br />
among the map classes.<br />
Prior to selecting sampling locations, all points surveyed during the mapping phase of the project<br />
(qualitative observation points <strong>and</strong> quantitative plots) were buffered by 40 m (131 ft) <strong>and</strong><br />
excluded from the sampling universe, effectively excluding all areas that had already been<br />
observed <strong>and</strong> classified. The ArcView 3.3 extension, R<strong>and</strong>om Point Generator v. 1.3 (Jenness<br />
2005), was used to r<strong>and</strong>omly select polygons within each map class, then to r<strong>and</strong>omly select<br />
points within those polygons. This extension generates r<strong>and</strong>om points within a specified<br />
distance for a set of input theme features (e.g. polygons), producing a new ArcView shapefile<br />
<strong>and</strong>/or a results table. Where possible, accuracy assessment points were generated so that they<br />
were at least 40 m (131 ft) from polygon edges. The size <strong>and</strong> linearity of some polygons,<br />
however, made it impossible to meet these criteria for all polygons. Decreasing edge buffer<br />
distances 30 m, 20 m, or 10 m (98 ft, 66 ft, or 33 ft) were used as necessary based on polygon<br />
size <strong>and</strong> shape. Using these methods, three sets of 183 r<strong>and</strong>om points (primary, secondary, <strong>and</strong><br />
tertiary) were generated for each the r<strong>and</strong>om polygon in each map class. Primary points were<br />
reviewed over aerial photos <strong>and</strong> topographic maps, <strong>and</strong> secondary or tertiary points were<br />
substituted when there where access limitations or if the point fell on a road or outside the park<br />
boundary.<br />
Field staff were provided with maps showing the boundaries of the target polygons <strong>and</strong> the<br />
location of accuracy assessment points, as well as a GPS unit preloaded with all the accuracy<br />
assessment point locations. During August through October 2005, each accuracy assessment<br />
point was located in the field using a Garmin Map76 WAAS enabled GPS. A john boat was<br />
used to access remote marsh locations. Field staff determined the map class at the accuracy<br />
assessment point using a dichotomous key <strong>and</strong> detailed vegetation descriptions. Dominant <strong>and</strong><br />
characteristic vascular plant species were listed by strata with an indication of their prevalence in<br />
the st<strong>and</strong> (i.e. dominant, common, or rare). Qualitative observations were made that described<br />
any variation of vegetation or environment within the polygon, such as the inclusion of more<br />
than one class in a polygon. Field staff also estimated the percentage of the target polygon<br />
observed <strong>and</strong> any problems using the key or interpreting the vegetation type in the polygon. The<br />
minimum area of observation around the sampling point was 0.5 ha (1.2 ac) or a circle with a<br />
radius of approximately 40 m (131 ft). The accuracy assessment data form used in this study is<br />
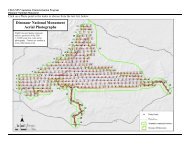
shown in Appendix B. Figures 6 <strong>and</strong> 7 show the locations of the 183 accuracy assessment<br />
points. Accuracy assessment data collected from these 183 points were entered into the PLOTS<br />
database version 2.0 (NatureServe 2004) <strong>and</strong> are provided as a supplement to this report.<br />
43