

Report Services Document Analysis Guide - MicroStrategy
Report Services Document Analysis Guide - MicroStrategy
Report Services Document Analysis Guide - MicroStrategy

You also want an ePaper? Increase the reach of your titles
YUMPU automatically turns print PDFs into web optimized ePapers that Google loves.
<strong>Report</strong> <strong>Services</strong> <strong>Document</strong> <strong>Analysis</strong> <strong>Guide</strong> Analyzing <strong>Document</strong>s in <strong>MicroStrategy</strong> Web 3<br />
Types of microcharts<br />
The different types of microcharts are:<br />
• Bar charts, which plot a metric with respect to time using a single bar,<br />
displaying a metric’s current value and historical value to visualize the<br />
shape of the trend.<br />
• Sparklines, which plot a metric with respect to time using a line graph,<br />
displaying a metric’s current value and historical data to visualize the<br />
shape of the trend. Sparkline microcharts consist of the following:<br />
A line graph that depicts the metric’s value over time.<br />
A horizontal reference line, which provides a comparison point<br />
between the actual values and the reference values.<br />
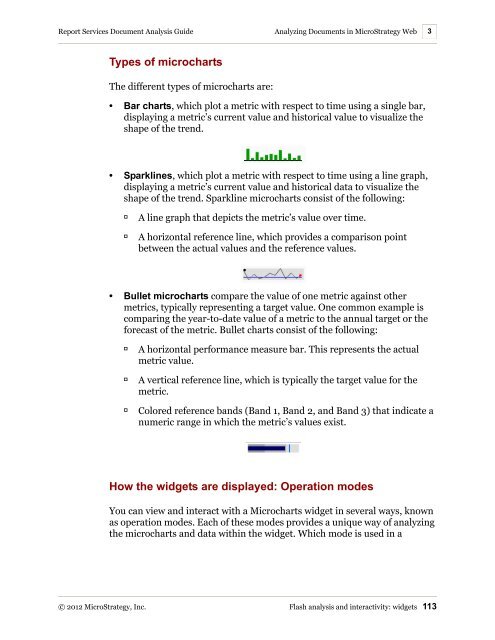
• Bullet microcharts compare the value of one metric against other<br />
metrics, typically representing a target value. One common example is<br />
comparing the year-to-date value of a metric to the annual target or the<br />
forecast of the metric. Bullet charts consist of the following:<br />
A horizontal performance measure bar. This represents the actual<br />
metric value.<br />
A vertical reference line, which is typically the target value for the<br />
metric.<br />
Colored reference bands (Band 1, Band 2, and Band 3) that indicate a<br />
numeric range in which the metric’s values exist.<br />
How the widgets are displayed: Operation modes<br />
You can view and interact with a Microcharts widget in several ways, known<br />
as operation modes. Each of these modes provides a unique way of analyzing<br />
the microcharts and data within the widget. Which mode is used in a<br />
© 2012 <strong>MicroStrategy</strong>, Inc. Flash analysis and interactivity: widgets 113


![The New Era of Mobile Intelligence: [PDF] - MicroStrategy](https://img.yumpu.com/13859921/1/190x245/the-new-era-of-mobile-intelligence-pdf-microstrategy.jpg?quality=85)
![customer success story [pdf] - MicroStrategy](https://img.yumpu.com/13859884/1/190x146/customer-success-story-pdf-microstrategy.jpg?quality=85)
![Call for Speakers Guide [PDF] - MicroStrategy](https://img.yumpu.com/13859856/1/190x245/call-for-speakers-guide-pdf-microstrategy.jpg?quality=85)

