

Report Services Document Analysis Guide - MicroStrategy
Report Services Document Analysis Guide - MicroStrategy
Report Services Document Analysis Guide - MicroStrategy

Create successful ePaper yourself
Turn your PDF publications into a flip-book with our unique Google optimized e-Paper software.
3<br />
Analyzing <strong>Document</strong>s in <strong>MicroStrategy</strong> Web <strong>Report</strong> <strong>Services</strong> <strong>Document</strong> <strong>Analysis</strong> <strong>Guide</strong><br />
document width is currently larger than the width of the browser, the<br />
document shrinks to fit the browser's width.<br />
• Select Fit Page to view the document within the working space<br />
available in <strong>MicroStrategy</strong> Web.<br />
Opening and interacting with a document in<br />
<strong>MicroStrategy</strong> Web<br />
Display<br />
Mode<br />
Express<br />
Mode<br />
(formerly<br />
called<br />
View<br />
Mode)<br />
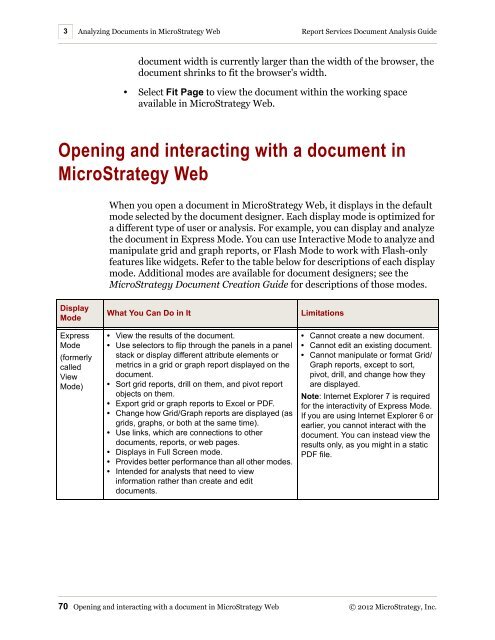
When you open a document in <strong>MicroStrategy</strong> Web, it displays in the default<br />
mode selected by the document designer. Each display mode is optimized for<br />
a different type of user or analysis. For example, you can display and analyze<br />
the document in Express Mode. You can use Interactive Mode to analyze and<br />
manipulate grid and graph reports, or Flash Mode to work with Flash-only<br />
features like widgets. Refer to the table below for descriptions of each display<br />
mode. Additional modes are available for document designers; see the<br />
<strong>MicroStrategy</strong> <strong>Document</strong> Creation <strong>Guide</strong> for descriptions of those modes.<br />
What You Can Do in It Limitations<br />
• View the results of the document.<br />
• Use selectors to flip through the panels in a panel<br />
stack or display different attribute elements or<br />
metrics in a grid or graph report displayed on the<br />
document.<br />
• Sort grid reports, drill on them, and pivot report<br />
objects on them.<br />
• Export grid or graph reports to Excel or PDF.<br />
• Change how Grid/Graph reports are displayed (as<br />
grids, graphs, or both at the same time).<br />
• Use links, which are connections to other<br />
documents, reports, or web pages.<br />
• Displays in Full Screen mode.<br />
• Provides better performance than all other modes.<br />
• Intended for analysts that need to view<br />
information rather than create and edit<br />
documents.<br />
• Cannot create a new document.<br />
• Cannot edit an existing document.<br />
• Cannot manipulate or format Grid/<br />
Graph reports, except to sort,<br />
pivot, drill, and change how they<br />
are displayed.<br />
Note: Internet Explorer 7 is required<br />
for the interactivity of Express Mode.<br />
If you are using Internet Explorer 6 or<br />
earlier, you cannot interact with the<br />
document. You can instead view the<br />
results only, as you might in a static<br />
PDF file.<br />
70 Opening and interacting with a document in <strong>MicroStrategy</strong> Web © 2012 <strong>MicroStrategy</strong>, Inc.


![The New Era of Mobile Intelligence: [PDF] - MicroStrategy](https://img.yumpu.com/13859921/1/190x245/the-new-era-of-mobile-intelligence-pdf-microstrategy.jpg?quality=85)
![customer success story [pdf] - MicroStrategy](https://img.yumpu.com/13859884/1/190x146/customer-success-story-pdf-microstrategy.jpg?quality=85)
![Call for Speakers Guide [PDF] - MicroStrategy](https://img.yumpu.com/13859856/1/190x245/call-for-speakers-guide-pdf-microstrategy.jpg?quality=85)

