Edwin Jan Klein - Universiteit Twente
Edwin Jan Klein - Universiteit Twente
Edwin Jan Klein - Universiteit Twente

You also want an ePaper? Increase the reach of your titles
YUMPU automatically turns print PDFs into web optimized ePapers that Google loves.
P<br />
Through<br />
P<br />
In<br />
P<br />
Drop =<br />
P<br />
In<br />
= 1+ F5.<br />
F<br />
F5.F4<br />
75<br />
3<br />
Simulation and analysis<br />
(4.11)<br />
(4.12)<br />
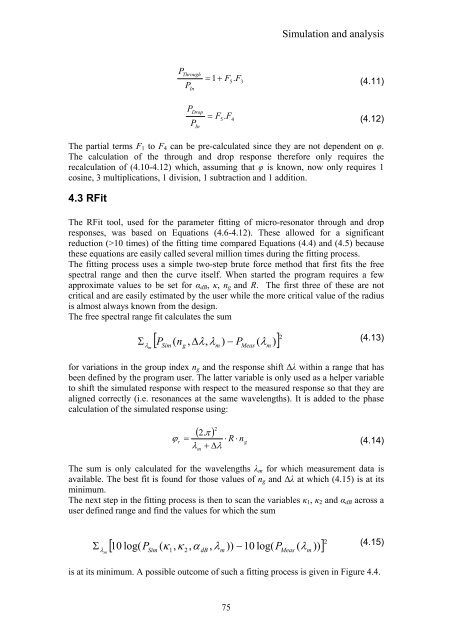
The partial terms F1 to F4 can be pre-calculated since they are not dependent on φ.<br />
The calculation of the through and drop response therefore only requires the<br />
recalculation of (4.10-4.12) which, assuming that φ is known, now only requires 1<br />
cosine, 3 multiplications, 1 division, 1 subtraction and 1 addition.<br />
4.3 RFit<br />
The RFit tool, used for the parameter fitting of micro-resonator through and drop<br />
responses, was based on Equations (4.6-4.12). These allowed for a significant<br />
reduction (>10 times) of the fitting time compared Equations (4.4) and (4.5) because<br />
these equations are easily called several million times during the fitting process.<br />
The fitting process uses a simple two-step brute force method that first fits the free<br />
spectral range and then the curve itself. When started the program requires a few<br />
approximate values to be set for αdB, κ, ng and R. The first three of these are not<br />
critical and are easily estimated by the user while the more critical value of the radius<br />
is almost always known from the design.<br />
The free spectral range fit calculates the sum<br />
Σ<br />
λ<br />
m<br />
[ ] 2<br />
P n , ∆λ,<br />
λ ) − P ( λ )<br />
Sim<br />
( g m Meas m<br />
(4.13)<br />
for variations in the group index ng and the response shift ∆λ within a range that has<br />
been defined by the program user. The latter variable is only used as a helper variable<br />
to shift the simulated response with respect to the measured response so that they are<br />
aligned correctly (i.e. resonances at the same wavelengths). It is added to the phase<br />
calculation of the simulated response using:<br />
( 2.<br />
π )<br />
ϕ r = ⋅ R ⋅ n<br />
λ + ∆λ<br />
m<br />
2<br />
g<br />
(4.14)<br />
The sum is only calculated for the wavelengths λm for which measurement data is<br />
available. The best fit is found for those values of ng and ∆λ at which (4.15) is at its<br />
minimum.<br />
The next step in the fitting process is then to scan the variables κ1, κ2 and αdB across a<br />
user defined range and find the values for which the sum<br />
Σ<br />
m<br />
[ ] 2<br />
log( P ( κ , κ , α , λ )) −10<br />
log( P ( λ ))<br />
λ 10 Sim 1 2 dB m<br />
Meas m<br />
(4.15)<br />
is at its minimum. A possible outcome of such a fitting process is given in Figure 4.4.