- Page 1 and 2:
Interim Assessment of the Denatured
- Page 3:
i L i b I, i L L bi L L Contract No
- Page 7 and 8:
1, L L t i Ltr 1 L L V PREFACE AND
- Page 9 and 10:
L i Li 1, I b k b id ii t L id b i
- Page 11 and 12:
I L bi i; L 7.3.1. Possible Procedu
- Page 13 and 14:
i xi I b L ABSTRACT A fuel cycle th
- Page 15 and 16:
I b .- i, hd t t CHAPTER 1 INTRODUC
- Page 17 and 18:
- - I 4d _- t .- ! Lili L Ld id .-
- Page 19 and 20:
L .- k id .- I L: _ - I iclr .- i b
- Page 21 and 22:
I, G - -- I id ..- ! I _. I: L _.-
- Page 23 and 24:
huJ -- AI I ' b --- I bl --- t L L
- Page 25 and 26:
-- t Li - I' b -. c (u I i ai L i i
- Page 27 and 28:
L - i' u i Lt L r- L t- b L 2-7 den
- Page 29 and 30:
2-9 1. Nuclear power is limited to
- Page 31:
e Isr i L i- b t CHAPTER 3 ISOTOPIC
- Page 34 and 35:
232" Fig. 3.0-1. Decay of 232U. ORN
- Page 36 and 37:
3-6 3.1. ESTIMATED U CONCENTRATIONS
- Page 38 and 39:
3-8 The values in Table 3.1-2 are a
- Page 40 and 41:
3-1 0 3.2. RADIOLOGICAL HAZARDS OF
- Page 42 and 43:
3-1 2 232u IN RECYCLED HTGR FUEL (p
- Page 44 and 45:
3-14 3.2.2 Toxicity of 232Th Given
- Page 46 and 47:
1. 2. 3. 4. 5. 6. 7. 8. 9. 10. 11.
- Page 48 and 49:
3.18 There are three approaches whi
- Page 50 and 51:
1 i i 3-20 3.3.2. Fabrication and H
- Page 52 and 53:
The 3-22 3.3.3 Detection and Assay
- Page 54 and 55:
3-24 3.3.4. Potential Circumvention
- Page 56 and 57:
3-26 - either large centrifuge pilo
- Page 58 and 59:
! 3-28 Table 3.3-3. Enriched Proauc
- Page 60 and 61:
3-30 The high alpha activity of ura
- Page 62 and 63:
3- 32 Table 3.3-7. Sumry of Results
- Page 64 and 65:
3-34 statistical redundancy through
- Page 66 and 67:
introduce time, cost and visibility
- Page 68 and 69:
3-38 An additional factor relative
- Page 71 and 72:
I b t I t L 1; L t ki 4.0. 4.1. CHA
- Page 73 and 74:
L L _ _ { i J _- \ I b B u il c _.
- Page 75 and 76:
Y m I I I . aro ID0 10.00 4-5 ORNL-
- Page 77 and 78:
t .. -. F 4d -- I ' L 0- 122, L _-
- Page 79 and 80:
L L; L t -I I ' b L -- t i b -- I;
- Page 81 and 82:
_- I -- L i d .-- L 4-1 1 Reference
- Page 83 and 84:
_- id L t I , 4d i, L id L 5 bi t h
- Page 85 and 86:
-- - . & I I ' h I ' Y 61 L -- I( L
- Page 87 and 88:
u -- x i I*i 1- bi 4-1 7 The use of
- Page 89 and 90:
la - i , I br -_ t c c L e L 4-1 9
- Page 91 and 92:
4-21 Case B" is a modification of C
- Page 93 and 94:
c 4-23 L i a L L 4.2. SPECTRAL-SHIF
- Page 95 and 96:
4-25 Initial analyses of spectral-s
- Page 97 and 98:
h 1' b t c i--; & I- & 1: i f 4-27
- Page 99 and 100:
c- i L L e I b 4-29 . safeguards fo
- Page 101 and 102:
L t i- bi L L t i 4-31 a significan
- Page 103 and 104:
~ kc'l c" -1 r-"! r! r-'i c Table 4
- Page 105 and 106:
F-- I iJ L ii - L c c 4-35 Referenc
- Page 107 and 108:
c r- L i] L h L __ f; t 4-37 trons
- Page 109 and 110:
Table 4.4-1. Fuel Utilization Chara
- Page 111 and 112:
L I 1 I Ld I ie i-- 1 t' 4-41 4.4.2
- Page 113 and 114:
4-43 Table 4.4-4. PBR Coated Partic
- Page 115 and 116:
HEU/Th 0.59 Seed i3 Breed 0.58 HEU/
- Page 117 and 118:
L i; 1 I i; i 1. 2. 3. 4. 5. 6. 7.
- Page 119 and 120:
4-49 Table 4.5-1. Fuel Utilization
- Page 121 and 122:
ments. 4-51 The calculations for LM
- Page 123 and 124:
1. 2. 3. 4. 5. 6. 7. 8. 4-53 0 77-1
- Page 125 and 126:
Table 4.6-1. Comparison of Fuel Uti
- Page 127 and 128:
4-57 _I 10 10' 2 2' CASE NUMBER -.
- Page 129 and 130:
4-59 Most of the information availa
- Page 131 and 132:
- i b k L L -- I , b -- I .- I Li L
- Page 133:
4-63 on only the preliminary data p
- Page 136 and 137:
c e E c
- Page 138 and 139:
! 5-4 5.1. REACTOR RESEARCH AND DEV
- Page 140 and 141:
5-6 As has been pointed out above,
- Page 142 and 143:
5-8 the LMFBR on its reference cycl
- Page 144 and 145:
5-10 The fuel performance program u
- Page 146 and 147:
. 5.1.2. Government Research and De
- Page 148 and 149:
5-1 4 The first aspect of large pla
- Page 150 and 151:
5-1 6 and should also address metho
- Page 152 and 153:
I DATA BASE DEMu)pMENT DEMO DESIGN
- Page 154 and 155:
j ~ 5-20 The R,D&D costs are highes
- Page 156 and 157:
5-22 In the case of metal-clad oxid
- Page 158 and 159:
5-24 5.2.2. Research, Development,
- Page 160 and 161:
5-26 program, including hot testing
- Page 162 and 163:
c c
- Page 164 and 165:
6-4 persed areas ensured - a fact w
- Page 166 and 167:
6-6 6.1.2. Reactor Options The reac
- Page 168 and 169:
Reactor/Cycl ea LWR-U5(LE)/U-S LUR-
- Page 170 and 171:
6-10 6.1.3. Nuclear Policy Options,
- Page 172 and 173:
Table 6.1-4. Nuclear Policy Options
- Page 174 and 175:
SWU SWU 6-14 UZJS USILEINS WYI U5IL
- Page 176 and 177:
6-16 n nM MEDL nows.1 Option 4: In
- Page 178 and 179:
6-18 HM HEDL7OOl.70.3 Option 6: In
- Page 180 and 181:
SRCIFIED CONSTRUCTION LlMllLD INTRO
- Page 182 and 183:
50- 40 6-22 c Y \ VL - :-: F 30- -
- Page 184 and 185:
6-24 The potential nuclear contribu
- Page 186 and 187:
%- f $400 J 2 s 2, 1 THE LWR FOLLOW
- Page 188 and 189:
141.6 ST - U308 4 7.2 lo3 swu ENRIC
- Page 190 and 191:
6-30 reactor. Since this increase i
- Page 192 and 193:
‘9. ,1 ST ‘3O8 6-32 12 Kg HM I
- Page 194 and 195:
6-34 1HE LWR WITH FISSILE UUNIUM PC
- Page 196 and 197:
THE LWR WITH PURONIUM MlNUllUTlON A
- Page 198 and 199:
6-38 be located in energy centers a
- Page 200 and 201:
6-40 installed capacity must be han
- Page 202 and 203:
lm, 1 I I I I mf RR WITH UGHT rwrmi
- Page 204 and 205:
6-44 6.2.7. Converter-Breeder Syste
- Page 206 and 207:
25.2 ST swu 6-46 19 Kg fir Pu 13 Kg
- Page 208 and 209:
6-48 Table 6.3-2. Summary of Result
- Page 210 and 211:
6-50 (4) If all plutonium produced
- Page 213 and 214:
I d r-- 1 > w I r- k z r L id r- .
- Page 215 and 216:
L 1 L u without benefit of U.S. exp
- Page 217 and 218:
L a, - L i -- k; L t IJ L 7-7 While
- Page 219 and 220:
7-9 Viewed solely from the plutoniu
- Page 221 and 222:
L L i; i; 7-1 1 routinely in LWRs a
- Page 223 and 224:
'I 7-1 3 t I: k: The isotopic compo
- Page 225 and 226:
U L L L L ld 1 i" * required 233U m
- Page 227 and 228:
I I, i 7-1 7 ii I 1 I L L k L i Thr
- Page 229 and 230:
li i i L Li L & I ' i kr ii L i h i
- Page 231 and 232:
7-21 7.3. PROSPECTS FOR IMPLEMENTAT
- Page 233 and 234:
L I L t L i L i 1 L 7-23 7.3.1. Pos
- Page 235 and 236:
7-25 7.3.2. Considerations in Comme
- Page 237 and 238:
.. I b k; L; i b b 1J I L 7-27 cycl
- Page 239 and 240:
7-29 7.4. ADEQUACY OF NUCLEAR POWER
- Page 241 and 242:
L i' hd .- - I ' i t L i' b i -' b
- Page 243 and 244:
x ibd 1 .. I i, L -- i t Table 7.4-
- Page 245 and 246:
7-35 cycled in Pu/Th converters, th
- Page 247 and 248:
L 1' b I_- ,- i b -- I ' b L 7-37 T
- Page 249 and 250:
..a 4 I- 1 ' u c1 Y u L 7-39 betwee
- Page 251 and 252:
L e, I I ' lb t 7-41 Systems that u
- Page 253 and 254:
e-. . ! hr L3 z i- b: i- b L c i li
- Page 255 and 256:
7-45 j I Table 7.5-1. Integrated As
- Page 257 and 258:
- isi. c ‘Id i L c 7-47 Although
- Page 259 and 260:
e Other e e e On the e 7-49 technol
- Page 261 and 262: t a APPENDICES
- Page 263 and 264: A-3 Appendix A. ISOTOPE SEPARATION
- Page 265 and 266: I] 1- $i ill 8 LI b' The Gas Centri
- Page 267 and 268: id A- 7 The Component Preparation L
- Page 269 and 270: i ?L 1- U t L fl bi L c u La -- ti
- Page 271 and 272: p; ‘U i-- L ,c c Japan A-1 1 Tabl
- Page 273 and 274: 13 A-13 L" efficient of the units d
- Page 275 and 276: L L L t I h h u L; _- t f is throug
- Page 277 and 278: u A-1 Aerodynamic Methods 7 Both th
- Page 279 and 280: i i d .- I . ii hi L i: i t ' Li 1
- Page 281 and 282: la t L I I, lj ir 1 Li c I L L' B-1
- Page 283 and 284: i; 1 t u 1 1 B-3 Table 8.5. Reactor
- Page 285 and 286: Table 6-7. Marginal Costs of U308 a
- Page 287 and 288: LJ L L1 a .E 4' P Y W 5 18 2 16 : 0
- Page 289 and 290: Appendix C. DETAILED RESULTS FROM E
- Page 291 and 292: 1 i; Li b L lkd t L L I hd I ' L; i
- Page 293 and 294: L c-5 The introduction of the class
- Page 295 and 296: i ' ibd 1 b i L L i L I Li . . b b
- Page 297 and 298: E , 1 ' b _. I ' L 1 b _- i G i' b
- Page 299 and 300: -, ii I ; b i- ii L b 4 i L L i‘
- Page 301 and 302: _- I ii I _ _ I L I td C i b L i, L
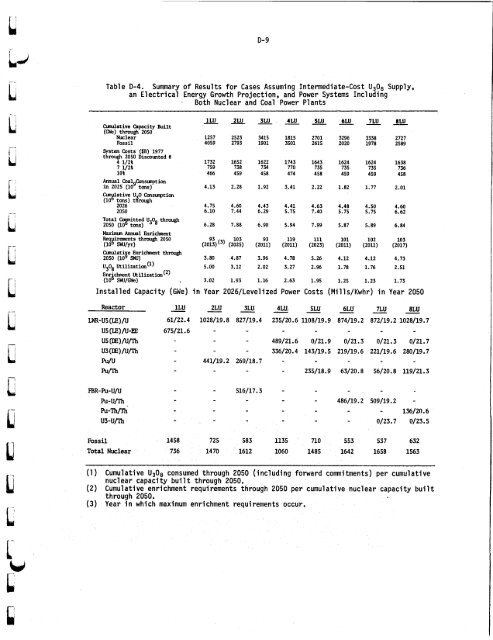
- Page 303 and 304: Qulatiw klur W i t y hilt (*I thrmg
- Page 305 and 306: L c c b - i ii L r D-1 Appendix D.
- Page 307 and 308: L L L L [i i” Table D -2. Maximum
- Page 309 and 310: Fig. D-2 (cont.) 25W I I I I I (I)
- Page 311: [i energy center. It can be seen fr
- Page 315 and 316: -- Lid c i' .- .b) i Internal Distr
- Page 317 and 318: It e L L L t u I' f ' ki Federal Ag
- Page 319: u 1' 1" Outside Organizations (cont


![Review of Molten Salt Reactor Physics Calculations [Disc 2]](https://img.yumpu.com/21979492/1/190x247/review-of-molten-salt-reactor-physics-calculations-disc-2.jpg?quality=85)