Salz Review - Wall Street Journal
Salz Review - Wall Street Journal
Salz Review - Wall Street Journal

You also want an ePaper? Increase the reach of your titles
YUMPU automatically turns print PDFs into web optimized ePapers that Google loves.
167 127<br />
169<br />
265<br />
232 63<br />
189 78<br />
286<br />
133 295<br />
<strong>Salz</strong> <strong>Review</strong><br />
An Independent <strong>Review</strong> of Barclays’ Business Practices<br />
196<br />
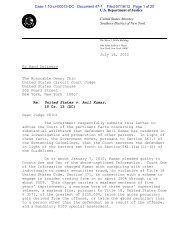
Appendix C – Complaints Statistics<br />
Total FSA-reportable complaints of Barclays Group and other main UK<br />
banking groups, H1 2010-H2 2012<br />
Total FSA-reportable complaints (thousands)<br />
900<br />
+39%<br />
800<br />
700<br />
600<br />
500<br />
400<br />
300<br />
308<br />
295<br />
267<br />
294<br />
455<br />
427<br />
200<br />
100<br />
0<br />
H1<br />
2010<br />
H2<br />
2010<br />
H1<br />
2011<br />
H2<br />
2011<br />
H1<br />
2012<br />
H2<br />
2012<br />
Barclays Group - General Insurance & Pure Protection<br />
Banking group B<br />
Barclays Group - Other<br />
Banking group C<br />
Banking group A<br />
Banking group D<br />
Note: Total complaints data comprises complaints in 5 categories (Banking; Home Finance; General Insurance & Pure<br />
Protection; Decumulation, Life and Pensions; Investments). We identify Barclays Group’s General Insurance and Pure<br />
Protection complaints as a proxy for PPI complaints. In the case of a discrepancy between complaints data reported on the<br />
FSA website and another bank’s website, we used the data reported on the FSA website<br />
Source: FSA complaints data, company websites, <strong>Salz</strong> <strong>Review</strong> analysis<br />
Barclays Group “banking” category FSA-reportable complaints per 1000<br />
accounts, H1 2010-H2 2012<br />
“Banking” category complaints per 1000 accounts<br />
8<br />
6<br />
-55%<br />
Barclays Group<br />
4<br />
2<br />
6.5<br />
5.6<br />
4.0<br />
3.7<br />
3.8<br />
2.9<br />
0<br />
H1 2010<br />
H2 2010<br />
H1 2011<br />
H2 2011<br />
H1 2012<br />
H2 2012<br />
Note: Data for Barclays Group , of which on average 97% of complaints reported are against Barclays Bank Plc . Complaints<br />
data falls into 5 categories (Banking; Home Finance; General Insurance and Pure Protection; Decumulation, Life and<br />
Pensions; and Investments) dominated by Banking and by General Insurance and Pure Protection. Figures for complaints per<br />
1000 accounts are reported by individual complaints categories only, without overall figures. We use Banking as a proxy overall,<br />
as total complaints data is skewed by PPI complaints. Banking category refers to credit cards, current accounts, savings<br />
(including cash ISA) and other banking accounts and unregulated loans<br />
Source: FSA complaints data, company websites, <strong>Salz</strong> <strong>Review</strong> analysis