- Page 1 and 2: Proceedings of the 25 th Annual Mee
- Page 3 and 4: Acta Scientiae Veterinariae. 39 (Su
- Page 5: Acta Scientiae Veterinariae. 39 (Su
- Page 8 and 9: Acta Scientiae Veterinariae. 39 (Su
- Page 10 and 11: Acta Scientiae Veterinariae. 39 (Su
- Page 12 and 13: Acta Scientiae Veterinariae. 39 (Su
- Page 14 and 15: Acta Scientiae Veterinariae. 39 (Su
- Page 16 and 17: Acta Scientiae Veterinariae. 39 (Su
- Page 18 and 19: Acta Scientiae Veterinariae. 39 (Su
- Page 20 and 21: Acta Scientiae Veterinariae. 39 (Su
- Page 22 and 23: A262 Bovine Oocyte Vitrification: E
- Page 25 and 26: C.A. Rodr drigues igues, R.M. Fer e
- Page 27 and 28: C.A. Rodr drigues igues, R.M. Fer e
- Page 29 and 30: C.A. Rodr drigues igues, R.M. Fer e
- Page 31 and 32: C.A. Rodr drigues igues, R.M. Fer e
- Page 33 and 34: C.A. Rodr drigues igues, R.M. Fer e
- Page 35: C.A. Rodr drigues igues, R.M. Fer e
- Page 38 and 39: L.F. Nasser asser, L. Pen enteado e
- Page 40 and 41: L.F. Nasser asser, L. Pen enteado e
- Page 42 and 43: L.F. Nasser asser, L. Pen enteado e
- Page 44 and 45: L.F. Nasser asser, L. Pen enteado e
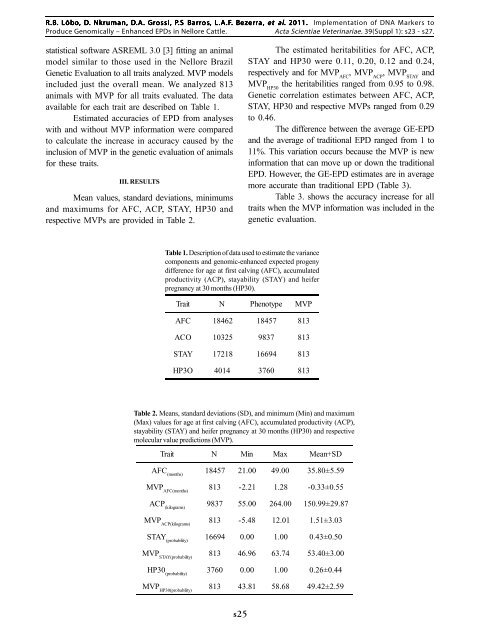
- Page 48 and 49: R.B. Lôbo, D. Nkr uman, D.A. Gross
- Page 51 and 52: M.E.F .F. Oliv liveir eira. 2011. E
- Page 53 and 54: M.E.F .F. Oliv liveir eira. 2011. E
- Page 55 and 56: M.E.F .F. Oliv liveir eira. 2011. E
- Page 57: M.E.F .F. Oliv liveir eira. 2011. E
- Page 60 and 61: A.L. Gusmão usmão. 2011. Estado d
- Page 62 and 63: A.L. Gusmão usmão. 2011. Estado d
- Page 64 and 65: A.L. Gusmão usmão. 2011. Estado d
- Page 66 and 67: J. R. Figueir igueiredo edo, A.P.R.
- Page 69 and 70: E.L.A. Motta, M. Nichi & P.C. Ser e
- Page 71 and 72: E.L.A. Motta, M. Nichi & P.C. Ser e
- Page 73 and 74: E.L.A. Motta, M. Nichi & P.C. Ser e
- Page 75 and 76: E.L.A. Motta, M. Nichi & P.C. Ser e
- Page 77: E.L.A. Motta, M. Nichi & P.C. Ser e
- Page 80 and 81: E.L.Gastal, M.O. Gastal, A. Wischra
- Page 82 and 83: E.L.Gastal, M.O. Gastal, A. Wischra
- Page 84 and 85: E.L.Gastal, M.O. Gastal, A. Wischra
- Page 86 and 87: E.L.Gastal, M.O. Gastal, A. Wischra
- Page 88 and 89: E.L.Gastal, M.O. Gastal, A. Wischra
- Page 90 and 91: E.L.Gastal, M.O. Gastal, A. Wischra
- Page 92 and 93: E.L.Gastal, M.O. Gastal, A. Wischra
- Page 95 and 96: D.P .P.A.F .A.F. Braga & E. Bor org
- Page 97 and 98:
D.P .P.A.F .A.F. Braga & E. Bor org
- Page 99 and 100:
D.P .P.A.F .A.F. Braga & E. Bor org
- Page 101 and 102:
D.P .P.A.F .A.F. Braga & E. Bor org
- Page 103:
M.E.F .F. Oliv liveir eira. 2011. E
- Page 106 and 107:
F.F .F. Bressan, F. Per erecin, eci
- Page 108 and 109:
F.F .F. Bressan, F. Per erecin, eci
- Page 110 and 111:
F.F .F. Bressan, F. Per erecin, eci
- Page 112 and 113:
F.F .F. Bressan, F. Per erecin, eci
- Page 114 and 115:
F.F .F. Bressan, F. Per erecin, eci
- Page 116 and 117:
F.F .F. Bressan, F. Per erecin, eci
- Page 119 and 120:
C.E. Ambrósio mbrósio, C.V. Wenc
- Page 121 and 122:
C.E. Ambrósio mbrósio, C.V. Wenc
- Page 123:
C.E. Ambrósio mbrósio, C.V. Wenc
- Page 127 and 128:
J.C. Fer erreir eira, F.S. Ignácio
- Page 129 and 130:
J.C. Fer erreir eira, F.S. Ignácio
- Page 131 and 132:
J.C. Fer erreir eira, F.S. Ignácio
- Page 133:
J.C. Fer erreir eira, F.S. Ignácio
- Page 136 and 137:
R.C. Uliani, L.A. Silv ilva, M.A. A
- Page 138 and 139:
R.C. Uliani, L.A. Silv ilva, M.A. A
- Page 140 and 141:
F.S. Ignácio, J.C. Fer erreir eira
- Page 142 and 143:
F.S. Ignácio, J.C. Fer erreir eira
- Page 145 and 146:
L.A. Silva. 2011. Local Effect of t
- Page 147 and 148:
L.A. Silva. 2011. Local Effect of t
- Page 149 and 150:
L.A. Silva. 2011. Local Effect of t
- Page 151 and 152:
L.A. Silva. 2011. Local Effect of t
- Page 153 and 154:
L.A. Silva. 2011. Local Effect of t
- Page 155 and 156:
L.A. Silva. 2011. Local Effect of t
- Page 157 and 158:
M.M. Franc anco, A. Pellegr ellegri
- Page 159 and 160:
M.M. Franc anco, A. Pellegr ellegri
- Page 161 and 162:
B. Str troud & G.A. Bó. 2011. The
- Page 163 and 164:
B. Str troud & G.A. Bó. 2011. The
- Page 165 and 166:
B. Str troud & G.A. Bó. 2011. The
- Page 167 and 168:
B. Str troud & G.A. Bó. 2011. The
- Page 169 and 170:
W.W .W. Tha hatcher cher. 2011. Tem
- Page 171 and 172:
W.W .W. Tha hatcher cher. 2011. Tem
- Page 173 and 174:
W.W .W. Tha hatcher cher. 2011. Tem
- Page 175 and 176:
W.W .W. Tha hatcher cher. 2011. Tem
- Page 177 and 178:
W.W .W. Tha hatcher cher. 2011. Tem
- Page 179 and 180:
W.W .W. Tha hatcher cher. 2011. Tem
- Page 181 and 182:
W.W .W. Tha hatcher cher. 2011. Tem
- Page 183 and 184:
W.W .W. Tha hatcher cher. 2011. Tem
- Page 185 and 186:
W.W .W. Tha hatcher cher. 2011. Tem
- Page 187 and 188:
W.W .W. Tha hatcher cher. 2011. Tem
- Page 189 and 190:
W.W .W. Tha hatcher cher. 2011. Tem
- Page 191:
W.W .W. Tha hatcher cher. 2011. Tem
- Page 195 and 196:
O. Sandra. 2011. Deciphering early
- Page 197 and 198:
O. Sandra. 2011. Deciphering early
- Page 199 and 200:
O. Sandra. 2011. Deciphering early
- Page 201 and 202:
O. Sandra. 2011. Deciphering early
- Page 203 and 204:
O. Sandra. 2011. Deciphering early
- Page 205 and 206:
R.C. Cheb hebel. el. 2011. Use of A
- Page 207 and 208:
R.C. Cheb hebel. el. 2011. Use of A
- Page 209 and 210:
R.C. Cheb hebel. el. 2011. Use of A
- Page 211 and 212:
R.C. Cheb hebel. el. 2011. Use of A
- Page 213 and 214:
R.C. Cheb hebel. el. 2011. Use of A
- Page 215 and 216:
R.C. Cheb hebel. el. 2011. Use of A
- Page 217 and 218:
R.C. Cheb hebel. el. 2011. Use of A
- Page 219 and 220:
R.C. Cheb hebel. el. 2011. Use of A
- Page 221 and 222:
R.C. Cheb hebel. el. 2011. Use of A
- Page 223 and 224:
R.C. Cheb hebel. el. 2011. Use of A
- Page 225 and 226:
R.C. Cheb hebel. el. 2011. Use of A
- Page 227 and 228:
R.C. Cheb hebel. el. 2011. Use of A
- Page 229 and 230:
R.C. Cheb hebel. el. 2011. Use of A
- Page 231 and 232:
R.C. Cheb hebel. el. 2011. Use of A
- Page 233 and 234:
R.C. Cheb hebel. el. 2011. Use of A
- Page 235 and 236:
R.C. Cheb hebel. el. 2011. Use of A
- Page 237 and 238:
R.C. Cheb hebel. el. 2011. Use of A
- Page 239 and 240:
R.C. Cheb hebel. el. 2011. Use of A
- Page 241 and 242:
R.C. Cheb hebel. el. 2011. Use of A
- Page 243:
R.C. Cheb hebel. el. 2011. Use of A
- Page 246 and 247:
A.C.A. Net eto, A.R. Galdos aldos,
- Page 248 and 249:
A.C.A. Net eto, A.R. Galdos aldos,
- Page 250 and 251:
P.C .Cha havett ette-P e-Palmer alm
- Page 252 and 253:
P.C .Cha havett ette-P e-Palmer alm
- Page 254 and 255:
P.C .Cha havett ette-P e-Palmer alm
- Page 256 and 257:
P.C .Cha havett ette-P e-Palmer alm
- Page 258 and 259:
P.C .Cha havett ette-P e-Palmer alm
- Page 260 and 261:
P.C .Cha havett ette-P e-Palmer alm
- Page 262 and 263:
P.C .Cha havett ette-P e-Palmer alm
- Page 264 and 265:
P.C .Cha havett ette-P e-Palmer alm
- Page 266 and 267:
E.H. Bir irgel Junior unior, F.V .V
- Page 268 and 269:
E.H. Bir irgel Junior unior, F.V .V
- Page 270 and 271:
E.H. Bir irgel Junior unior, F.V .V
- Page 272 and 273:
E.H. Bir irgel Junior unior, F.V .V
- Page 274 and 275:
E.H. Bir irgel Junior unior, F.V .V
- Page 276 and 277:
P. Humblot. 2011. Reproductive Tech
- Page 278 and 279:
P. Humblot. 2011. Reproductive Tech
- Page 280 and 281:
P. Humblot. 2011. Reproductive Tech
- Page 282 and 283:
P. Humblot. 2011. Reproductive Tech
- Page 284 and 285:
P. Humblot. 2011. Reproductive Tech
- Page 286 and 287:
J.A. Piedrahita. 2011. Application
- Page 288 and 289:
J.A. Piedrahita. 2011. Application
- Page 290 and 291:
J.A. Piedrahita. 2011. Application
- Page 292 and 293:
J.A. Piedrahita. 2011. Application
- Page 294 and 295:
J.A. Piedrahita. 2011. Application
- Page 296 and 297:
O.E. Smith, B.D. Murphy & L.C. Smit
- Page 298 and 299:
O.E. Smith, B.D. Murphy & L.C. Smit
- Page 300 and 301:
O.E. Smith, B.D. Murphy & L.C. Smit
- Page 302 and 303:
O.E. Smith, B.D. Murphy & L.C. Smit
- Page 304 and 305:
O.E. Smith, B.D. Murphy & L.C. Smit
- Page 307 and 308:
D. Salamone alamone, R. Bevacqua, F
- Page 309 and 310:
D. Salamone alamone, R. Bevacqua, F
- Page 311 and 312:
D. Salamone alamone, R. Bevacqua, F
- Page 313 and 314:
D. Salamone alamone, R. Bevacqua, F
- Page 315:
D. Salamone alamone, R. Bevacqua, F
- Page 318 and 319:
E.A. Maga & J.D. Mur urray. 2011. G
- Page 320 and 321:
E.A. Maga & J.D. Mur urray. 2011. G
- Page 322 and 323:
E.A. Maga & J.D. Mur urray. 2011. G
- Page 325:
R.C. Uliani, L.A. Silv ilva, M.A. A
- Page 328 and 329:
C.G. Gutier utierrez, S. Fer errar
- Page 330 and 331:
C.G. Gutier utierrez, S. Fer errar
- Page 332 and 333:
C.G. Gutier utierrez, S. Fer errar
- Page 334 and 335:
C.G. Gutier utierrez, S. Fer errar
- Page 336 and 337:
C.G. Gutier utierrez, S. Fer errar
- Page 338 and 339:
C.G. Gutier utierrez, S. Fer errar
- Page 340 and 341:
B. Gasparrini. 2011. Ovum pick-up a
- Page 342 and 343:
B. Gasparrini. 2011. Ovum pick-up a
- Page 344 and 345:
B. Gasparrini. 2011. Ovum pick-up a
- Page 346 and 347:
B. Gasparrini. 2011. Ovum pick-up a
- Page 348 and 349:
B. Gasparrini. 2011. Ovum pick-up a
- Page 350 and 351:
B. Gasparrini. 2011. Ovum pick-up a
- Page 352 and 353:
B. Gasparrini. 2011. Ovum pick-up a
- Page 354 and 355:
B. Gasparrini. 2011. Ovum pick-up a
- Page 356 and 357:
B. Gasparrini. 2011. Ovum pick-up a
- Page 359 and 360:
Acta Scientiae Veterinariae, 2011.
- Page 361 and 362:
Acta Scientiae Veterinariae, 2011.
- Page 363 and 364:
Acta Scientiae Veterinariae, 2011.
- Page 365 and 366:
Acta Scientiae Veterinariae, 2011.
- Page 367 and 368:
Acta Scientiae Veterinariae, 2011.
- Page 369 and 370:
Acta Scientiae Veterinariae, 2011.
- Page 371 and 372:
Acta Scientiae Veterinariae, 2011.
- Page 373 and 374:
Acta Scientiae Veterinariae, 2011.
- Page 375 and 376:
Acta Scientiae Veterinariae, 2011.
- Page 377 and 378:
Acta Scientiae Veterinariae, 2011.
- Page 379 and 380:
Acta Scientiae Veterinariae, 2011.
- Page 381 and 382:
Acta Scientiae Veterinariae, 2011.
- Page 383 and 384:
Acta Scientiae Veterinariae, 2011.
- Page 385 and 386:
Acta Scientiae Veterinariae, 2011.
- Page 387 and 388:
Acta Scientiae Veterinariae, 2011.
- Page 389 and 390:
Acta Scientiae Veterinariae, 2011.
- Page 391 and 392:
Acta Scientiae Veterinariae, 2011.
- Page 393 and 394:
Acta Scientiae Veterinariae, 2011.
- Page 395 and 396:
Acta Scientiae Veterinariae, 2011.
- Page 397 and 398:
Acta Scientiae Veterinariae, 2011.
- Page 399 and 400:
Acta Scientiae Veterinariae, 2011.
- Page 401 and 402:
Acta Scientiae Veterinariae, 2011.
- Page 403 and 404:
Acta Scientiae Veterinariae, 2011.
- Page 405 and 406:
Acta Scientiae Veterinariae, 2011.
- Page 407 and 408:
Acta Scientiae Veterinariae, 2011.
- Page 409 and 410:
Acta Scientiae Veterinariae, 2011.
- Page 411 and 412:
Acta Scientiae Veterinariae, 2011.
- Page 413 and 414:
Acta Scientiae Veterinariae, 2011.
- Page 415 and 416:
Acta Scientiae Veterinariae, 2011.
- Page 417 and 418:
Acta Scientiae Veterinariae, 2011.
- Page 419 and 420:
Acta Scientiae Veterinariae, 2011.
- Page 421 and 422:
Acta Scientiae Veterinariae, 2011.
- Page 423 and 424:
Acta Scientiae Veterinariae, 2011.
- Page 425 and 426:
Acta Scientiae Veterinariae, 2011.
- Page 427 and 428:
Acta Scientiae Veterinariae, 2011.
- Page 429 and 430:
Acta Scientiae Veterinariae, 2011.
- Page 431 and 432:
Acta Scientiae Veterinariae, 2011.
- Page 433 and 434:
Acta Scientiae Veterinariae, 2011.
- Page 435 and 436:
Acta Scientiae Veterinariae, 2011.
- Page 437 and 438:
Acta Scientiae Veterinariae, 2011.
- Page 439 and 440:
Acta Scientiae Veterinariae, 2011.
- Page 441 and 442:
Acta Scientiae Veterinariae, 2011.
- Page 443 and 444:
Acta Scientiae Veterinariae, 2011.
- Page 445 and 446:
Acta Scientiae Veterinariae, 2011.
- Page 447 and 448:
Acta Scientiae Veterinariae, 2011.
- Page 449 and 450:
Acta Scientiae Veterinariae, 2011.
- Page 451 and 452:
Acta Scientiae Veterinariae, 2011.
- Page 453 and 454:
Acta Scientiae Veterinariae, 2011.
- Page 455 and 456:
Acta Scientiae Veterinariae, 2011.
- Page 457 and 458:
Acta Scientiae Veterinariae, 2011.
- Page 459 and 460:
Acta Scientiae Veterinariae, 2011.
- Page 461 and 462:
Acta Scientiae Veterinariae, 2011.
- Page 463 and 464:
Acta Scientiae Veterinariae, 2011.
- Page 465 and 466:
Acta Scientiae Veterinariae, 2011.
- Page 467 and 468:
Acta Scientiae Veterinariae, 2011.
- Page 469 and 470:
Acta Scientiae Veterinariae, 2011.
- Page 471 and 472:
Acta Scientiae Veterinariae, 2011.
- Page 473 and 474:
Acta Scientiae Veterinariae, 2011.
- Page 475 and 476:
Acta Scientiae Veterinariae, 2011.
- Page 477 and 478:
Acta Scientiae Veterinariae, 2011.
- Page 479 and 480:
Acta Scientiae Veterinariae, 2011.
- Page 481 and 482:
Acta Scientiae Veterinariae, 2011.
- Page 483 and 484:
Acta Scientiae Veterinariae, 2011.
- Page 485 and 486:
Acta Scientiae Veterinariae, 2011.
- Page 487 and 488:
Acta Scientiae Veterinariae, 2011.
- Page 489:
Acta Scientiae Veterinariae, 2011.