study of environments to support e- learning in uk further and ... - Jisc
study of environments to support e- learning in uk further and ... - Jisc
study of environments to support e- learning in uk further and ... - Jisc

Create successful ePaper yourself
Turn your PDF publications into a flip-book with our unique Google optimized e-Paper software.
Environments <strong>to</strong> <strong>support</strong> e-Learn<strong>in</strong>g In UK Further <strong>and</strong> Higher Education<br />
Weight<strong>in</strong>g<br />
17. As the previous section shows, there was little, if any, response bias <strong>in</strong> the achieved<br />
sample apart from the HE/FE split. The results needed adjust<strong>in</strong>g <strong>to</strong> correct for the better<br />
response rate among HE <strong>in</strong>stitutions so that the data did not over-represent views <strong>of</strong> the HE<br />
sec<strong>to</strong>r. Without such correction the conclusions drawn from the data would have been<br />
skewed <strong>to</strong>wards the situation <strong>in</strong> HE <strong>in</strong>stitutions. . It was recommended <strong>and</strong> accepted by the<br />
project Reference Group that all other variables were left as they are – the more the data are<br />
weighted the greater the impact on sampl<strong>in</strong>g error.<br />
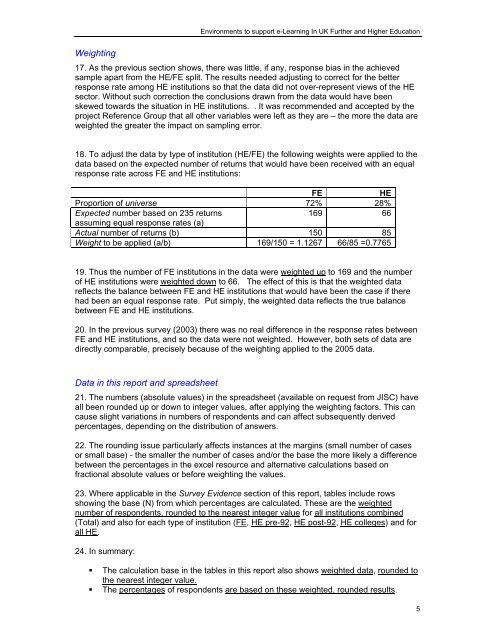
18. To adjust the data by type <strong>of</strong> <strong>in</strong>stitution (HE/FE) the follow<strong>in</strong>g weights were applied <strong>to</strong> the<br />
data based on the expected number <strong>of</strong> returns that would have been received with an equal<br />
response rate across FE <strong>and</strong> HE <strong>in</strong>stitutions:<br />
FE<br />
HE<br />
Proportion <strong>of</strong> universe 72% 28%<br />
Expected number based on 235 returns<br />
169 66<br />
assum<strong>in</strong>g equal response rates (a)<br />
Actual number <strong>of</strong> returns (b) 150 85<br />
Weight <strong>to</strong> be applied (a/b) 169/150 = 1.1267 66/85 =0.7765<br />
19. Thus the number <strong>of</strong> FE <strong>in</strong>stitutions <strong>in</strong> the data were weighted up <strong>to</strong> 169 <strong>and</strong> the number<br />
<strong>of</strong> HE <strong>in</strong>stitutions were weighted down <strong>to</strong> 66. The effect <strong>of</strong> this is that the weighted data<br />
reflects the balance between FE <strong>and</strong> HE <strong>in</strong>stitutions that would have been the case if there<br />
had been an equal response rate. Put simply, the weighted data reflects the true balance<br />
between FE <strong>and</strong> HE <strong>in</strong>stitutions.<br />
20. In the previous survey (2003) there was no real difference <strong>in</strong> the response rates between<br />
FE <strong>and</strong> HE <strong>in</strong>stitutions, <strong>and</strong> so the data were not weighted. However, both sets <strong>of</strong> data are<br />
directly comparable, precisely because <strong>of</strong> the weight<strong>in</strong>g applied <strong>to</strong> the 2005 data.<br />
Data <strong>in</strong> this report <strong>and</strong> spreadsheet<br />
21. The numbers (absolute values) <strong>in</strong> the spreadsheet (available on request from JISC) have<br />
all been rounded up or down <strong>to</strong> <strong>in</strong>teger values, after apply<strong>in</strong>g the weight<strong>in</strong>g fac<strong>to</strong>rs. This can<br />
cause slight variations <strong>in</strong> numbers <strong>of</strong> respondents <strong>and</strong> can affect subsequently derived<br />
percentages, depend<strong>in</strong>g on the distribution <strong>of</strong> answers.<br />
22. The round<strong>in</strong>g issue particularly affects <strong>in</strong>stances at the marg<strong>in</strong>s (small number <strong>of</strong> cases<br />
or small base) - the smaller the number <strong>of</strong> cases <strong>and</strong>/or the base the more likely a difference<br />
between the percentages <strong>in</strong> the excel resource <strong>and</strong> alternative calculations based on<br />
fractional absolute values or before weight<strong>in</strong>g the values.<br />
23. Where applicable <strong>in</strong> the Survey Evidence section <strong>of</strong> this report, tables <strong>in</strong>clude rows<br />
show<strong>in</strong>g the base (N) from which percentages are calculated. These are the weighted<br />
number <strong>of</strong> respondents, rounded <strong>to</strong> the nearest <strong>in</strong>teger value for all <strong>in</strong>stitutions comb<strong>in</strong>ed<br />
(Total) <strong>and</strong> also for each type <strong>of</strong> <strong>in</strong>stitution (FE, HE pre-92, HE post-92, HE colleges) <strong>and</strong> for<br />
all HE.<br />
24. In summary:<br />
• The calculation base <strong>in</strong> the tables <strong>in</strong> this report also shows weighted data, rounded <strong>to</strong><br />
the nearest <strong>in</strong>teger value.<br />
• The percentages <strong>of</strong> respondents are based on these weighted, rounded results.<br />
5